
In a prior posting I had graphs of GHCN v3 thermometers that were in the data set at different quasi random eras. Mostly about 50 years apart, but not consistently.
https://chiefio.wordpress.com/2019/03/11/thermometers-over-time/
This set of graphs will not be directly comparable for two reasons. First off, the year ranges are not exactly the same. Mostly this will not matter as the important cutoffs are the same or close enough. The second change is that instead of using “ranges” like “between 1850 and 1900” I’ve just gone with “Year FOO or before”. This ought to have nearly no impact as the older thermometers tend to persist into the following group OTHER THAN post the “baseline” period of about 1950 to 1990. To capture that effect I’ve included a “Now” graph of 2018 or newer (i.e. into the first few months of 2019).
In general, as expected, the years prior to about 1950 don’t change much. The reality of the few thermometers in the past “just is”. Then we get more in the “baseline” era and recently. I’m not seeing where comparing 27,000 thermometers “now” to 50 years ago tells us anything about climate in the context of known cycles of climate 60 to 200 years long (and longer) other than what part of the cycle one has chosen to measure. Certainly any comparisons to older data than the “baseline” are plagued by lack of data for comparison.
But take a look and see what you think.

GHCN v4 1800 and Before

GHCN v4 Coverage 1850 and Before

GHCN v4 Coverage 1900 and Before

GHCN v4 Coverage Before 1950
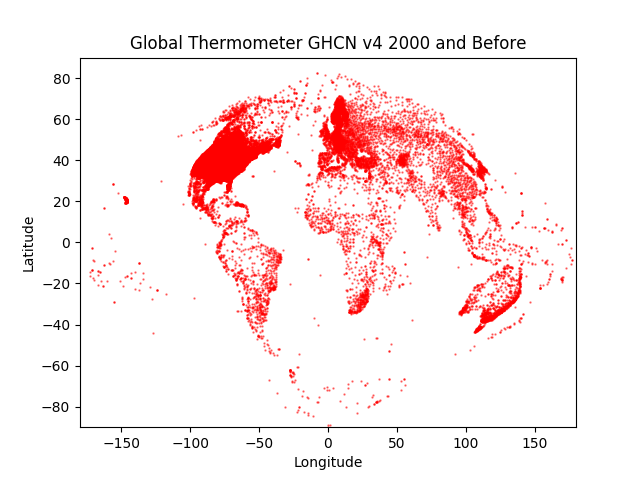
GHCN v4 Coverage 2000 and Before
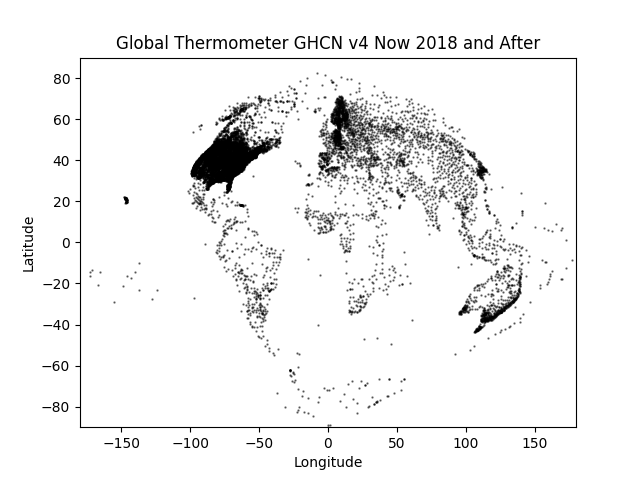
GHCN v4 Coverage “Now” (2018 and newer)
Tech Talk
Here’s the MariaDB / MySQL schemas and the Python that made the above graphs:
CREATE TABLE invent4 (
    stnID      CHAR(11) NOT NULL,
    country    CHAR(3) NOT NULL,
    f1         CHAR(1),
    f2         CHAR(1),
    f3         CHAR(1),
    f4         CHAR(1),
    wmo        CHAR(5) NOT NULL,
    wnl        CHAR(6) NOT NULL,
    latitude   CHAR(8),
    longitude  CHAR(9),
    stn_elev   CHAR(6),
    name       CHAR(30) NOT NULL,
    version    CHAR(5) NOT NULL,
    ascension  CHAR(10),
    type       CHAR(4),
    coslong    CHAR(9),
    PRIMARY KEY (stnID)
    ) ;
CREATE TABLE temps4 (
    stnID CHAR(11) NOT NULL,
    abrev CHAR(2) NOT NULL,
    F1    CHAR(1),
    F2    CHAR(1),
    F3    CHAR(1),
    F4    CHAR(1),
    wmo   CHAR(5),
    year CHAR(4) NOT NULL,
    type CHAR(4) NOT NULL,
    version  CHAR(5) NOT NULL,
    ascension CHAR(10),
    month CHAR(4),
    deg_c DECIMAL(5,2),
    missing  CHAR(1),
    qc       CHAR(1),
    source   CHAR(1),
    PRIMARY KEY (stnID,year,month,type)
    ) ;
chiefio@PiM3Devuan2:~/Py3$ cat 4FiftyYr.py
# -*- coding: utf-8 -*-
import datetime
import pandas as pd
import numpy as np
import matplotlib.pylab as plt
import math
import mysql.connector as MySQLdb

plt.title("Global Thermometer GHCN v4 1800 and Before")
plt.xlabel("Longitude")
plt.ylabel("Latitude")
plt.xlim(-180,180)
plt.ylim(-90,90)

try:
    db=MySQLdb.connect(user="chiefio",password="LetMeIn!",database='temps')
    cursor=db.cursor()

    print("doing before 1801")

    sql="SELECT I.latitude, I.coslong FROM invent4 AS I INNER JOIN temps4 as T on I.stnID=T.stnID WHERE year<1801 GROUP BY I.stnID;"

    cursor.execute(sql)
    stn=cursor.fetchall()
    data = np.array(list(stn))
    xs = data.transpose()[0]   # or xs = data.T[0] or  xs = data[:,0]
    ys = data.transpose()[1]

    plt.scatter(ys,xs,s=0.5,color='blue',alpha=0.5)

    plt.show()

    plt.title("Global Thermometer GHCN v4 1850 and Before")
    plt.xlabel("Longitude")
    plt.ylabel("Latitude")
    plt.xlim(-180,180)
    plt.ylim(-90,90)

    print("doing before 1851")

    sql="SELECT I.latitude, I.coslong FROM invent4 AS I INNER JOIN temps4 as T on I.stnID=T.stnID WHERE year<1851 GROUP BY I.stnID;"

    cursor.execute(sql)
    stn=cursor.fetchall()
    data = np.array(list(stn))
    xs = data.transpose()[0]   # or xs = data.T[0] or  xs = data[:,0]
    ys = data.transpose()[1]

    plt.scatter(ys,xs,s=0.5,color='green',alpha=0.5)

    plt.show()

    plt.title("Global Thermometer GHCN v4 1900 and Before")
    plt.xlabel("Longitude")
    plt.ylabel("Latitude")
    plt.xlim(-180,180)
    plt.ylim(-90,90)

    print("doing before 1901")

    sql="SELECT I.latitude, I.coslong FROM invent4 AS I INNER JOIN temps4 as T on I.stnID=T.stnID WHERE year<1901 GROUP BY I.stnID;"

    cursor.execute(sql)
    stn=cursor.fetchall()
    data = np.array(list(stn))
    xs = data.transpose()[0]   # or xs = data.T[0] or  xs = data[:,0]
    ys = data.transpose()[1]

    plt.scatter(ys,xs,s=0.5,color='orange')

    plt.show()

    print("doing Before 1950")

    plt.title("Global Thermometer GHCN v4 Before 1950")
    plt.xlabel("Longitude")
    plt.ylabel("Latitude")
    plt.xlim(-180,180)
    plt.ylim(-90,90)
    sql="SELECT I.latitude, I.coslong FROM invent4 AS I INNER JOIN temps4 as T on I.stnID=T.stnID WHERE year<1950 GROUP BY I.stnID;"

    cursor.execute(sql)
    stn=cursor.fetchall()
    data = np.array(list(stn))
    xs = data.transpose()[0]   # or xs = data.T[0] or  xs = data[:,0]
    ys = data.transpose()[1]

    plt.scatter(ys,xs,s=0.5,color='purple')
    plt.show()

    print("doing Before 2001")

    plt.title("Global Thermometer GHCN v4 2000 and Before")
    plt.xlabel("Longitude")
    plt.ylabel("Latitude")
    plt.xlim(-180,180)
    plt.ylim(-90,90)

    sql="SELECT I.latitude, I.coslong FROM invent4 AS I INNER JOIN temps4 as T on I.stnID=T.stnID WHERE year2017 GROUP BY I.stnID;"

    cursor.execute(sql)
    stn=cursor.fetchall()
    data = np.array(list(stn))
    xs = data.transpose()[0]   # or xs = data.T[0] or  xs = data[:,0]
    ys = data.transpose()[1]

    plt.scatter(ys,xs,s=0.5,color='black',alpha=0.5)

    plt.show()


except:
    print ("This is the exception branch")

finally:
    print ("All Done")
    if db:
        db.close()

Can I ask a very ‘primitive’ question?
The temperature daily averages are themselves averaged into months etc…
However, the so called daily average is the arithmetic mean of maximum temperature and minimum temperature. Apart from the nonsense of averaging an intensive variable, there is a basic error in the application of the math. If minimum temperatures are not as low and top temperatures are the same or dropping less than the minimum temperatures are rising then the daily averages will show a ‘rise’ in temperature which is entirely artificial as all that is happening is there is the minimum temperatures are not as cold.
If this rise in ‘average’ temperature were to be taken as an anomaly then those without understanding of its genesis could claim that the site is ‘warming’
So the question is the mean of daily max and min taken as the ‘temperature’ of that site and then graphed as an increase in temperature rather than a decrease in minimum temperatures?
This would be hidden by all the clever algorithms and TOBS corrections etc,.
Ian W, Yes.
It has not got very much warmer, but it has got less cold based on Thermometer changes and some minor warming since the LIA.
If that is the case, the entire AGW claim could be based on faulty math generating rising anomalies but not rising maximum temperatures.
Surely it cannot be that basic?
Looks like the manufacturers of thermometers must have done well 1850 – 1900?
@Ian W: Yes it can. Provided you add a footnote that there are other bits of stupid too.
Unfortunately, the MIN and MAX data are even more sparse and a little harder to work with. Other folks have, and shown MAX more stable and MIN rising more. I did a little some years ago. I hope to do similar with v4 “someday” – but there is much to do, little time, life demands, and no money; so “all the Science that fits” for free after things like growing food and roofing the house, repairing cars, mowing lawns, being chef & bottle washer…
One of the manufacturers
“Welcome to ZEAL the genuine article since 1888”
By the distributors list still doing their best to fill out the map
http://www.zeal.co.uk/
E M I’d love to contribute on all the maths and figures of this post. But I cannot get my head around it all at the moment.
But this may give some context in a non mathematical way to what this is all about.
Here in Oz a local Greenist is pushing for the local Adelaide Hills Council to pass some motion about a ‘Climate Emergency’.
No doubt all part of the campaign to elect a ‘Greenist’ type Labor government in 2019, no doubt.
But this country of ours has always had an ‘erratic’ climate. Right now we are in drought. but when the first Fleet arrived at Sydney Cove in 1788, Australia was in the midst of dry hot Summer. Fresh water from the “Tank stream” was rationed for everyone – convicts, free settlers and soldiers alike – because there was so little fresh water.
Our changeable climate is written into our Australian consciousness. And has been for generations.
It’s also in our poetry. I posted one famous example a week ago from 1921 – ‘ SAID HANRAHAN”. Here is an even more famous example:
“I love a sunburnt country,
A land of sweeping plains,
Of ragged mountain ranges,
Of droughts and flooding rains.
I love her far horizons,
I love her jewel-sea,
Her beauty and her terror
The wide brown land for me!
The stark white ring-barked forests,
All tragic to the moon,
The sapphire-misted mountains,
The hot gold hush of noon,
Green tangle of the brushes
Where lithe lianas coil,
And orchids deck the tree-tops,
And ferns the warm dark soil.
Core of my heart, my country!
Her pitiless blue sky,
When, sick at heart, around us
We see the cattle die
But then the grey clouds gather,
And we can bless again
The drumming of an army,
The steady soaking rain.
Core of my heart, my country!
Land of the rainbow gold,
For flood and fire and famine
She pays us back threefold.
Over the thirsty paddocks,
Watch, after many days,
The filmy veil of greenness
That thickens as we gaze …
An opal-hearted country,
A wilful, lavish land
All you who have not loved her,
You will not understand
though Earth holds many splendours,
Wherever I may die,
I know to what brown country
My homing thoughts will fly. ”
Dorothea Mackeller ~ 1902
Pingback: GHCN v3.3 vs v4 – Top Level Entry Point | Musings from the Chiefio