
It’s a simple thing. There are these maps. They say where the ocean water wanders. Authoritative. Well reasoned. Based on the best science. Centuries of observations and wisdom.
One Small Problem: They have arrows going in the same places on some maps, different directions on others.
What does it mean? I donno….
Are the old maps wrong? Are some maps showing surface currents and others deep flow? Are some smaller currents, others larger? One season vs another? Again, I don’t know.
My guess would be some of each. Then again, maybe some of the new maps are just wrong too.
Now, since ocean tides and currents are strongly likely to be the determinant of our weather and longer term climate effects, perhaps some of these just show what was happening at different lunar / tidal states. In any case, if we only have a loose grip on what the oceans are doing, not going to get much right about the effect it has on the air and weather.
With no further ado, and in no particular order, some maps for you to contemplate, with sporadic comments and snideitude scattered through.
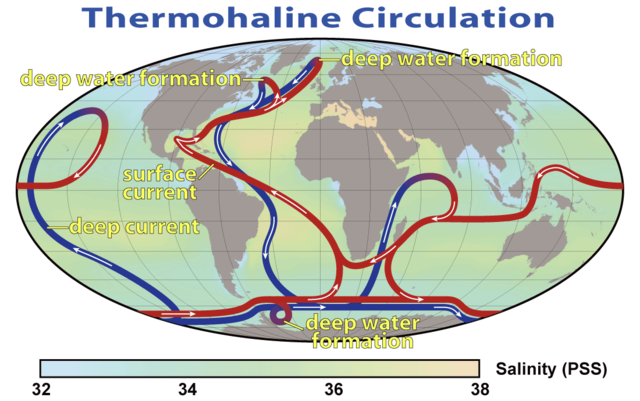
Thermohaline Circulation
The “big lumps”. Supposedly this is the most major layer of circulation. The core basic movement.
https://en.wikipedia.org/wiki/Thermohaline_circulation has some nice maps.
Thermohaline Circulation equatorial view
Attribution and Full Sized Image
And from a quasi south pole view:

Thermohaline Circulation from a nearly south pole view
Attribution and Full Sized Image
http://oceancurrents.rsmas.miami.edu/ocean-gyres.html
“This is one example of what oceanographers call thermohaline flow. The large-scale flow pattern that results from the sinking of water in the Nordic and Greenlans Seas and around Antartica is called the oceanic conveyor belt (figure 2a). Another example of thermohaline flow occurs in the Meditterean Sea in summer when water gets heavier due to strong evaporation that transports fresh water into the atmosphere, feeding the hydrological cycle, and leaves salts behind that make the water denser and it sinks. This salty water, produced in the Meditterean Sea, can be found in the Atlantic Ocean at depths of 1000 to 1500 m (figure 2b). ”
Nice, but in addition to some spelling errors, they don’t have the circumpolar current going all the way around the south pole:

Thermohaline Circulation from Miami.Edu
Though the more interesting thing from that link is the Mediterranean Salt Tongue.

Salt Contours North Atlantic
Ocean Gyres
https://en.wikipedia.org/wiki/Ocean_gyre
Now, the description of Ocean Gyres has some different ideas what the currents might be:
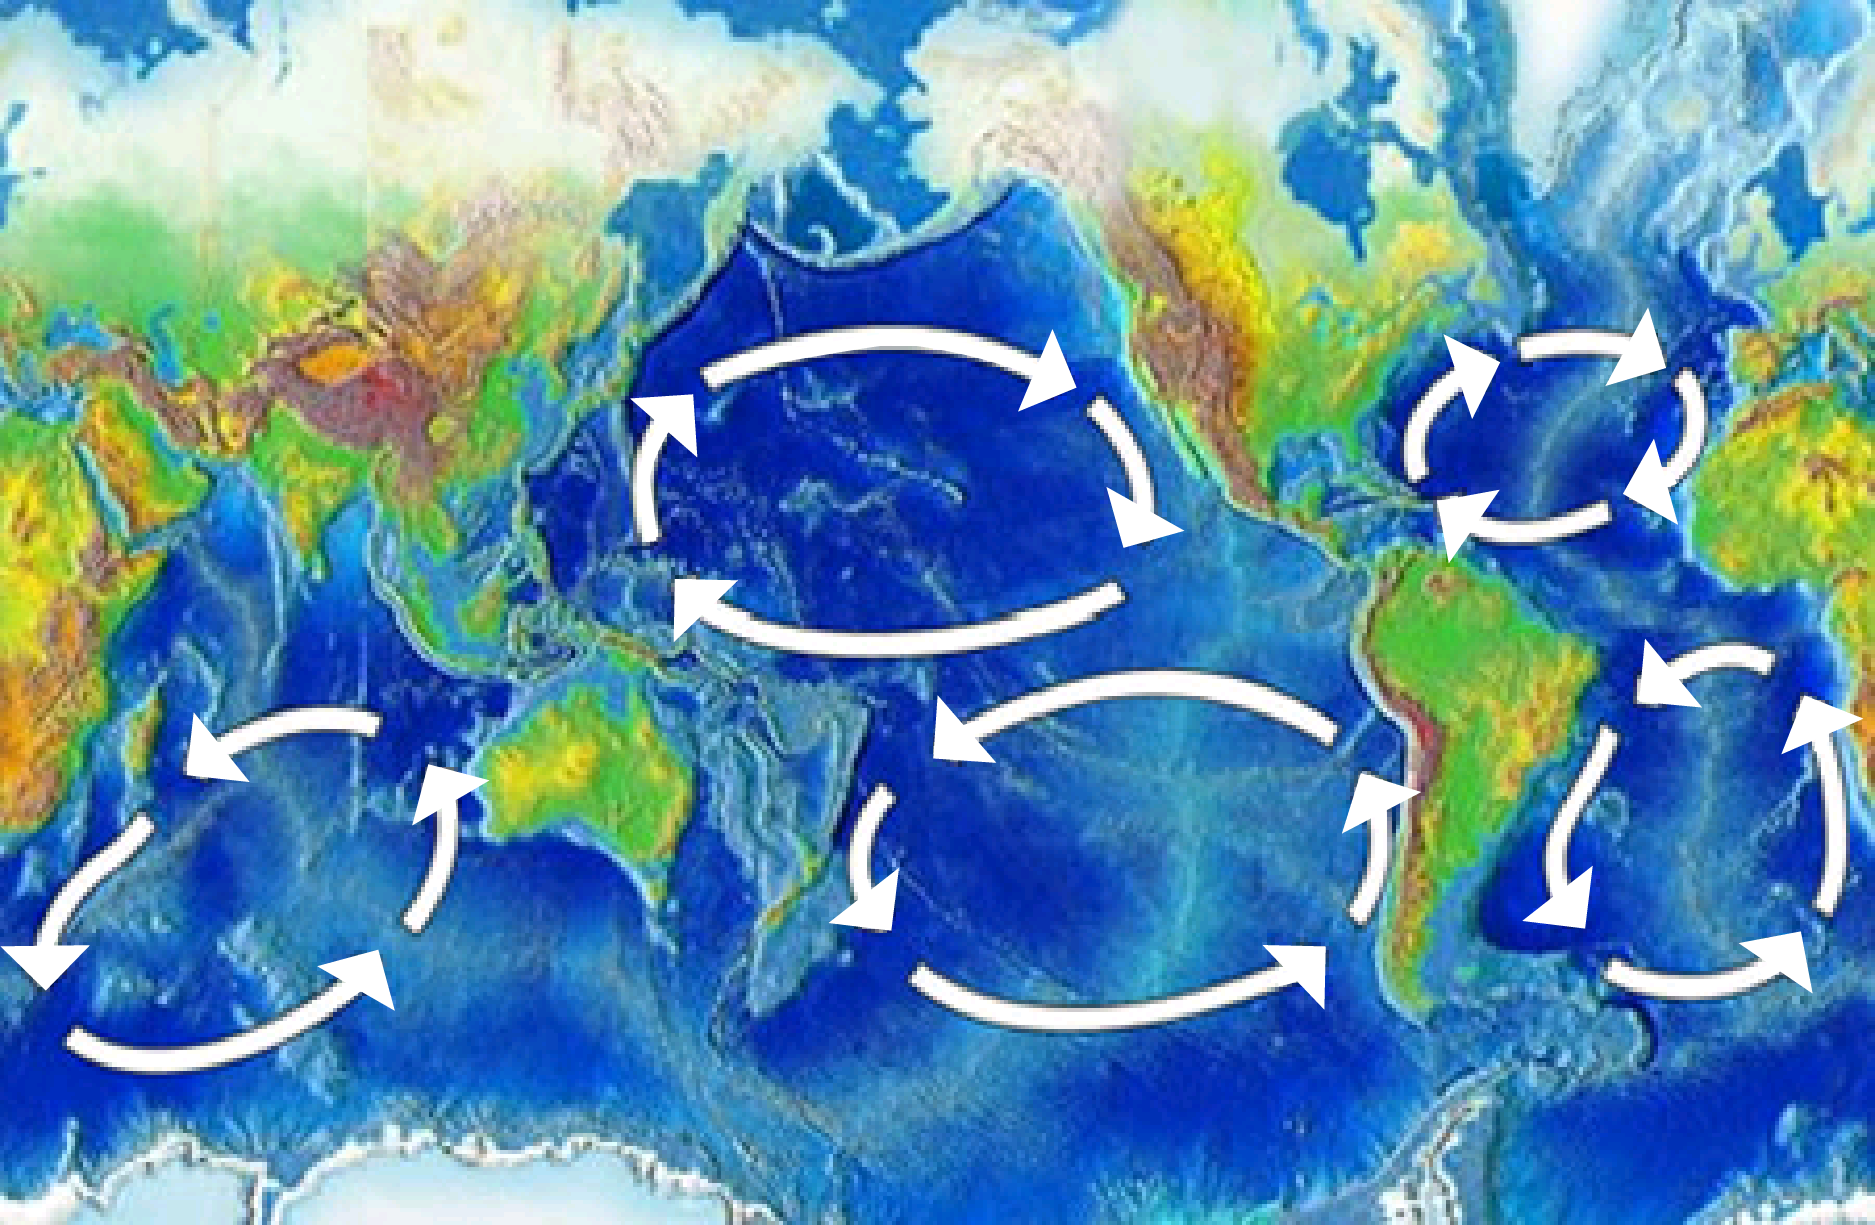
Conceptual Map Of Ocean Gyres
Attribution and Full Sized Image
Notice that they do not connect, and the part near Spain heads south, but turns west toward north America where it runs into North Africa. While long before reaching Africa, the Thermohaline map above has it flowing west in the middle of the Atlantic. Nearly nothing near Africa. Similarly, the south Atlantic gyre doesn’t show much in the thermohaline map.

Another view of ocean gyres
Attribution and Full Sized Image
Rather different…
Some Other Currents
https://en.wikipedia.org/wiki/Ocean_current
Has a bunch of things, including this alternate view of the salt tongue. Seems it really breaks up into salty “lenses” called “meddes” that drift around the Atlantic for a while…

Meddes or salt water lenses floating in the Atlantic Ocean
Attribution and Full Sized Image
The caption says:
Coupling data collected by NASA/JPL by several different satellite-borne sensors, researchers have been able to “break through” the ocean’s surface to detect “Meddies” — super-salty warm-water eddies that originate in the Mediterranean Sea and then sink more than a half-mile underwater in the Atlantic Ocean. The Meddies are shown in red in this scientific figure.
So we have “chunks” of water drifting around the Atlantic. Flowing out and sinking. Wonder if that counts as a “current”…
But wait, there’s more…
Somehow I think I trust this older map more than most. It also shows the limits of ice flow, ice berg sightings, and more. The full sized image is huge, and very detailed.

Ocean Currents from 1943
Attribution and Full Sized Image
NOAA has a view that is much more “disjoint” and conceptual… useful not so much:
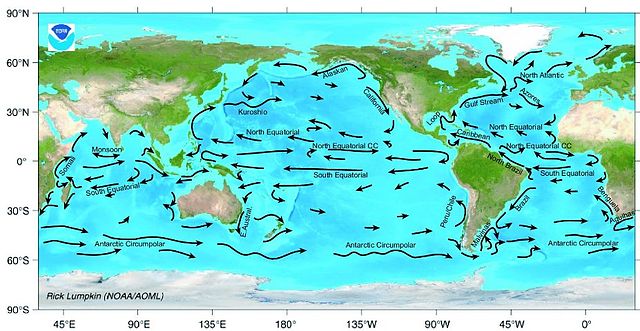
NOAA ocean current map
Attribution and Full Sized Image
It seems to be lacking the North Atlantic Gyre as well as any current going from Iberia down to Africa. It does have a nice equatorial current toward North America, but doesn’t show much of where that water comes from.
This one likes to have arrows run into each other, though it does have some hint of the gyres. There is also a tendency to have arrows start nowhere and end running into things. So the current headed south along the east (asian) side of Africa seems to start from nowhere and the one in the Indian Ocean next to it starts from Indonesia, makes a U turn and runs back into Indonesia, but not where it starts. Ending as mysteriously as it begins.

Yet More Ocean Currents
Attribution and Full Sized Image
In Conclusion
So where do the ocean currents go? The Ekman Sprial implies many different directions depending on depth and surface winds:
https://en.wikipedia.org/wiki/Ekman_spiral
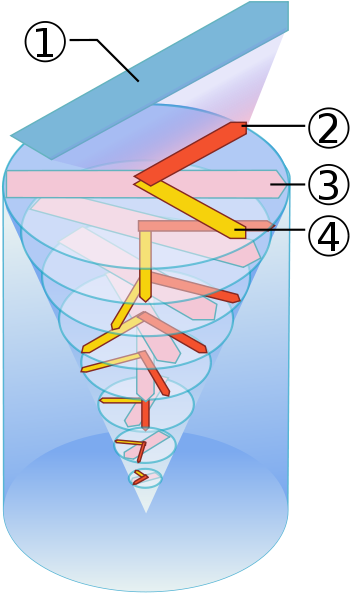
Ekman Spiral
Attribution and Full Sized Image
The diagram above attempts to show the forces associated with the Ekman spiral as applied to the Northern hemisphere. The force from above is in red (beginning with the wind blowing over the water surface), the Coriolis force (which is shown at right angles to the force from above when it should in fact be at right angles to the actual water flow) is in dark yellow, and the net resultant water movement is in pink, which then becomes the force from above for the layer below it, accounting for the gradual clockwise spiral motion as you move down.
The first documented observations of an oceanic Ekman spiral were made in the Arctic Ocean from a drifting ice flow in 1958.[
So… what’s a current to do. Lenses of salty water drifting sideways. Spirals of water shifting direction as depths advance. Major Gyers spanning oceans. But supposedly with steady currents crossing entire oceans. Some starting nowhere and ending nowhere.
Then a thermal picture of the Gulf Stream sure looks like reality is a whole lot more complicated. Rather like clouds. Eddies and swirls. Wisps wandering into other areas. Size dramatically changing. Full motion video is even more dynamic. I have no idea how one could begin to program that behaviour into a computer model.
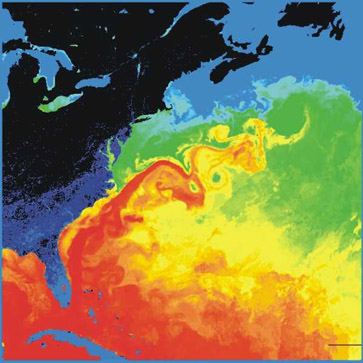
Gulf Stream thermal image
Attribution and Full Sized Image
All of which leads me to really wonder just how well the “climate codes” model oceans and currents. How much do those various “conceptual maps” above reflect anything real? With what resolution? On what time scales? With what dynamics over time?
To me, it looks like a real fools errand to try to explain how those “currents” move heat around the planet and impact weather and climate. It is a huge, fine grained, and somewhat chaotic system.
If, as I expect, a lunar influence on tides and currents determines the very long cycles of weather and climate, the 79, 350, 1470, and even 1800 and 5000 year cyclical changes: It is going to be nearly impossible to figure out how they change the currents of today. We have essentially zero record of real past currents (especially at depth) to work from in figuring out what will happen in lunar / tidal regimes that have not been seen for 1500 to 5000 years.
We can’t model it. Heck, we don’t even have a consistent “story” about where currents move today (if that above muck of maps is any guide). Unexpected changes in something we poorly understand and can’t reliably describe are not going to be easily predicted.
It is also certainly the case that one can not look at that kind of system and say any “heat” is being reliably carried down into any particular depth of the oceans. Horizontal currents are barely covered, vertical hardly at all. There is no mass flow size nor temperature profiles to apply to that unknown mass. Any assertion we know what volume and temperature is flowing in the vertical is just insane. Then add a bunch of changes to tides on an 18.6 year cycle. And on a 56 year harmonic of that when any given face of the earth finally returns to being under the moon at the same part of the 18.6 year cycle.
To me, it just looks a lot like a poorly understood system.
But you look at the maps and see if you can make some sense out of them. Some kind of consistent understanding.

Second image : “Quasi South Pole view”.
First reflexive thought: ions in electrolyte circulating around a magnetic pole.
Further pondering required.
From NOAA …
How Are Currents Measured?
An online book …
Measuring Ocean Currents
NOAA again …
The Challenge of Measuring Water Currents
Until the pause became double digits, climate scientists did not talk about the oceans at all. Theirs was a simple life (and for the most part still is), CO2=Warmer. Period. The pause caused them to start looking at excuses and places to hide the heat. But they have not even scratched the surface of what the oceans are doing (other than to note that El Niño made the atmosphere warmer, and La Niña made it cooler). Some, like Dr. Curry, have started looking to ocean currents for answers. But for the most part, other than claiming it is Long John Silver’s long lost hiding place for heat, Climate scientists have ignored the oceans. And they continue to this day. They have no understanding of the Oceans.
But the currents do play an important role. It is why Europe is so temperate – even when it is as far north as New England and Canada. it is why California is as well. There is a lot of learning to do there, that if the alarmist would let real scientists do their work, we could devote some of the riches they squander into understanding.
One thing (and I know of your time constraints, so just want to throw this out) that I noticed missing, was the antithesis of the Mediterranean Salt lick – the Amazon Fresh tongue! That probably has a lot to do with the movement of the gyres and currents in the Atlantic – those 2 forces unbalancing the Atlantic all the time. I wonder what impact that has on the Southern Hemisphere’s (and perhaps the Antarctic) temperature.
The large 1943 chart seems to be more correct about currents around Australia. There is a warm current the flows down the east cost to just below Wollongong. This stretches down further and closer to the coast in summer. There is a cold current from the Antarctic coming up past Tasmania & Victoria. Where the two currents meet is good fishing. The same applies on the west coast of Australia (water is cold around Perth). The Australia Bight (South Australian coast) has cold water. The Right & Blue whales which prefer cold water come up to the southern coast of WA, SA and Victoria at least to feed and maybe breed in winter. Other whales such as the Humpback go into the warm waters of WA & Qld to breed in winter and return to the Antarctic for the summer (the Japanese are presently there to do their supposed scientific whaling)
The Coral sea is a source of warm water currents and also a starting point for cyclones affecting Pacific Islands such as Fiji and the east coast of Australia.. Cyclones also start in the India ocean south of Indonesia and affect the north coast of WA and the top end of NT (Darwin)
The southern oscillation index relates to the atmospheric pressure difference between Tahiti and Darwin.
As Sherlock Holmes would say “Elementary my dear chap”
One good source of info on currents and seasonal wind patterns is “Ocean Passages For The World.” http://www.amazon.com/NP-136-Ocean-Passages-World/dp/B000KEY75A/ref=sr_1_1?s=books&ie=UTF8&qid=1391531447&sr=1-1
Over two centuries of information from sailing ships around the world. Good ocean sailors still have one in their book locker.
One problem is that each map only represents a few years before the map was published. One map is only somewhat comparable to the next due to seasonal,yearly,decadal changes in the circulations, specially surface ones. That 1943 map likely was the best surface representation available at that time. It was for planning surface shipping routing. I would think that there are yearly up dates somewhere.
You are right, too many moving parts for any clear projections of future climate changes due to surface ocean circulation changes. Any model that works today would be wrong next year. We know that watching the sun and moon works. That has been done for thousands of years, but moderns now expect computers to tell them. Maybe “Old Wizards” should be programing the computers instead of young Physicists/climatologists. lol pg
Would the Argo float system now provide a reasonable idea of at least the surface currents? It should be possible to track the progression of positions of each buoy. It is probable that DOD knows a lot about currents below the thermocline but they may be unwilling to publish it.
I was going to comment on the last two articles on Lunar orbital variability and super tides by bringing in all of this information into the discussion as a ‘wondering out loud’ about how significant changes in tidal magnitudes might be relative to all of the other forces that move water around in the oceans.
I guess I’m glad I was able to show SOME self restraint – but I can’t hold out forever.
Do changes in tidal amplitude act as a positive feedback to other processes? A negative feedback? Positive or negative feedback in different places? Switch signs at different magnitudes? The world wonders.
Also, as far as thermohaline circulation in the ocean goes, I remember a while ago reading an article, that I now cannot find anywhere, suggesting that the now fifty year old ‘ocean conveyor belt’ model was in need of some serious adjustment. This article back from 2009 over at WUWT isn’t it, but dates form the right time frame:
The original Woods Hole article:
http://www.eurekalert.org/pub_releases/2009-05/whoi-sfs051309.php
Well, everyone at that time [fifty years ago] recognized that the theory was provisional, a first pass with the data, a first approximation of a system that was known to be a very big unknown. Then fifty years went by and everyone forgot, and the original model became enshrined with the dusky mantle of antiquity, ‘that’s the way it is’. Until, some people who’s article I have now lost noticed that there are dead end eddies and vortices all over the place, many parts don’t seem to connect and nowhere is there a neat little flowing current as we see in the 1943 ocean current map [I’ve got a copy of that one too]. Turns out if you look from space that everywhere it looks more like a von Kármán vortex street, deeply turbulent, quasi periodic and governed by ????
At that time I made the rather bold prediction [and vague] that any branch of science that had not yet fully come to terms [in the mathematical sense of the word] with the effects of deep complexity, turbulence, and chaos was a branch of science that was about to have a major revisioning of their theory – within the next ten years or so.
I’ve seen nothing so far to cause me to back off on that assertion.
W^3
Okay, so not counting the sun, and not counting the oceans, and not counting the ocean conveyor belts, and not counting the lunar effect, wouldn’t you say co2 has warmed the globe, not counting water vapor (unless it amplifies co2), and not counting clouds?
Oh, as far as Ekman Transport goes I wouldn’t hang your hat [Trenbeth’s] on it as a mechanism for deep ocean mixing. Nice graphic from the Wiki, but that is an idealized visualization of the math and will meet the same fate as the Inviscid flow, rapidly, when it meets Mr. Viscosity. My semi-informed opinion is that Ekman Transport is constrained by the same basic physics that constrains the effect of wind driven gravity waves. Velocity diminishing rapidly with depth and as a function of wavelength and period i.e. longer wavelengths and shorter periods diminishing less rapidly with depth.
http://oceanmotion.org/html/background/ocean-in-motion.htm
Of course I would love to have my opinion upgraded by the fully informed.
W^3
Ian W asked, “Would the Argo float system now provide a reasonable idea of at least the surface currents?”
Start here … Estimation of the surface and mid-depth currents from Argo floats in the Pacific and error analysis
Thanks, Chiefio, for another indication of how little we actually know about the forces that control Earth’s ever changing climate.
So the current headed south along the east (asian) side of Africa seems to start from nowhere . . .
Off of eastern Africa winds reverse with the Monsoon (season) and were used by traders in ancient times. Here is one item:
http://www.penn.museum/sites/Roman%20Glass/Cullet/cullet_4map.html
The map in your post shows the winter season of flow from the northeast to the southwest. That the wind in this part of the world rarely heads eastward to Africa explains why that part of the continent is usually dry. The common vessel was the dhow but there is evidence that very large ships from China were once used.
http://www.pbs.org/wgbh/nova/ancient/ancient-chinese-explorers.html
Also, search the following for ‘ haskazi ‘, and read that paragraph.
http://www.saudiaramcoworld.com/issue/197402/ghosts.ships.in.the.gulf.htm
This is also interesting because it claims new findings regarding the history.
http://en.wikipedia.org/wiki/Lateen#Diffusion_to_Indian_Ocean
Ian W.
The Argo profiling [diving] floats can only transmit when at the surface, every 10 days or so. The array of 3000+ floats is ~3x3deg grid except for high latitudes. All current Argos measure temperature, conductance [salinity], and position [at surface]. Newer floats are beginning to add functionality such as: dissolved oxygen, pH & etc. Older floats spend as much as 12 hours at the surface newer floats ~20mintes. The floats are GPS equipped, but spend most of their lives parked at ~1000m between dives and surfacing – can’t transmit data, or receive GPS. Supposedly they measure currents “directly”, but that seems to actually mean inferring velocity and direction by calculating a position every 10 days while at surface – a relatively course measure compared to the accuracy of GPS. How far does an ARGO float in 10 days and what has happened on the surface in the mean time??
W^3
The map “yet more currents” lacks at least one: the “corriente fría de las Malvinas” that runs north from the Passage of Drake
http://es.wikipedia.org/wiki/Corriente_de_las_Malvinas
until it confronts the “corriente cálida del Brasil
http://es.wikipedia.org/wiki/Corriente_del_Brasil
in what is called the “confluencia subtropical”, influenced, no doubt, by the great masses of water coming from the estuary of the Río de la Plata.
Things are much more complicated that all of our united elucubrations
But….everything runs with electricity…and try to find anything which does not run with it…
This discovery of a pressurised deep sea system leaking, creating methane hydrate reef which can be traced & linked to a river bed in Australia (not as a ’cause’ but the same system’s outlet observed on land).
http://www.perthnow.com.au/news/western-australia/shark-mystery-sparks-bigger-questions-in-wa-marine-hotspot/story-fnhocxo3-1226749003794
https://www.google.com.au/#q=The+Search+for+the+Ocean's+Super+Predator
(The quote about the discovery of the riverbed I can’t pinpoint atm, but bookmarked it somewhere. It will be in a link supplied via google )
@ John F. Hultquist:
Omar Khayyam had a red dhow- he called it the ‘Ruby Yacht’.
I am curious. Do you have any thoughts on the persistent pressure anomaly essentially directly over the temperature anomaly in the gulf of Alaska? It would seem that an ocean currents are somehow realated.
“Before it is safe to attribute a global warming or a global cooling effect to any other factor (CO2 in particular) it is necessary to disentangle the simultaneous overlapping positive and negative effects of solar variation, PDO/ENSO and the other oceanic cycles. Sometimes they work in unison, sometimes they work against each other and until a formula has been developed to work in a majority of situations all our guesses about climate change must come to nought.”
from here:
http://www.newclimatemodel.com/the-real-link-between-solar-energy-ocean-cycles-and-global-temperature/
May 21, 2008
“But you look at the maps and see if you can make some sense out of them. Some kind of consistent understanding.”
The whole circulation system of oceans and air is the global thermostatic mechanism in action.
If ever energy in or out of the Earth system goes out of balance then both oceans and air alter their circulations in a negative system response which has been sufficient to retain our water oceans for billions of years.
The baseline energy content for the fluids of ocean and air is determined by the mass of the air above the oceans, the strength of the gravitational field and the amount of solar energy arriving from space.
Nothing else.
All other factors only stimulate circulation changes in water and air.
CO2 variations from human activity would be too small to discern against natural variations caused by sun and oceans.
Sera says:
The epic begins in Frostbite Falls on the shores of Lake Veronica, where Bullwinkle finds the Ruby Yacht of Omar Khayyam.
—————-
Stephen Wilde . . .
You quoted it so could not have missed the part where E.M. wrote:
“. . . until a formula has been developed to work in a majority of situations . . .
He means a set of things like this:
V = 4/3 ∏ r^3
Your essay is interesting but leaves much undetermined, little rigor, no formulas, and no sources of data. You seem to be at the starting line, but have not yet started.
John,
That was my quote from 2008 not Chiefio’s.
If you want rigour etc. then don’t hold back, get on with it.
I think you’ll find that my summation will be the end point rather than the starting point.
Maps don’t show you another feature – 10000km from equator to pole, and we are talking about water current layers 1-3km thick.
Also transport of heat into the deep/ cold to the surface is affected by waves – and bigger storms produce more rapid heat diffusion.
Added to the tidal induced motions, variable rates of ice formation, and very low flow rates and it becomes exceptionally difficult to model (though probably much easier than atmosphere due to no cloud and almost no radiative and very consistent conductive heat transfer). Yet it is the primary driver of world climate.
Ocean currents now animated on earth.nullschool.net
http://earth.nullschool.net/#current/ocean/surface/currents/equirectangular
@ John F. Hultquist:
That is still one of my favorite episodes, and laugh just as hard now as back then. I have the ‘Rubaiyat of Omar Khayyam’ in my secretary next to ‘Lotus Blossom’. Haven’t read it in years, but did you know that Omar was a mathematician, astronomer and philosopher? Sorta sounds like our Cheifio…
Maybe I should list some of his quatraines on the Ahkenaton thread…
In “Sustainable Energy Without The Hot Air” Sir David MacKay FRS says (page 255 of the pdf, page 242 by the document’s internal numbering, my bolds):
How does Keith Trenberth suggest that the missing warmth gets through the solid wall boundary into the unmeasurable ocean depths?
Pingback: Lunar Months, Tides; for Vukcevic | Musings from the Chiefio