
The article is cited in a couple of other places. I ran into it here:
Where Tallbloke points to the Elsevier / Science Direct origin (where it is paywalled…)
This supports the idea that temperature cycles in the region of 60 years are very likely a common feature of Earth’s climate.
Deploying a new technique for the first time in the region, geoscientists at the University of Massachusetts Amherst have reconstructed the longest and highest-resolution climate record for the Northeastern United States, which reveals previously undetected past temperature cycles and extends the record 900 years into the past, well beyond the previous early date of 1850, reports Phys.org.
And points at the description of the article at phys.org:
https://phys.org/news/2019-01-geoscientists-reconstruct-eye-opening-year-northeast.html
As Miller explains, they used a relatively new quantitative method based on the presence of chemical compounds known as branched glycerol dialkyl glycerol tetra ethers (branched GDGTs) found in lakes, soils, rivers and peat bogs around the world. The compounds can provide an independent terrestrial paleo-thermometer that accurately assesses past temperature variability.
Miller says, “This is the first effort using these compounds to reconstruct temperature in the Northeast, and the first one at this resolution.” He and colleagues were able to collect a total of 136 samples spanning the 900-year time span, many more than would be available with more traditional methods and from other locations that typically yield just one sample per 30-100 years.
I make that about a 6 2/3 year long duration per sample. So 9 samples per 60+ year cycle. A bit coarse but it ought to resolve with 4 to 5 samples per arc of excursion.
I find it a bit amusing that they are all worked up about having rediscovered the Medieval Warm Period and the Little Ice Age; but OK, at least we’re finally getting back to reality. They are amazed at the “new” finding of the same 60ish year cycle that has been found just about everywhere anyone actually looks for it. OK… All bolding by me.
In their results, Miller says, “We see essentially cooling throughout most of the record until the 1900s, which matches other paleo-records for North America. We see the Medieval Warm Period in the early part and the Little Ice Age in the 1800s.” An unexpected observation was 10, 50-to-60-year temperature cycles not seen before in records from Northeast U.S., he adds, “a new finding and surprising. We’re trying to figure out what causes that. It may be caused by changes in the North Atlantic Oscillation or some other atmospheric patterns. We’ll be looking further into it.”
He adds, “We’re very excited about this. I think it’s a great story of how grad students who come up with a promising idea, if they have enough support from their advisors, can produce a study with really eye-opening results.” Details appear in a recent issue of the European Geophysical Union’s open-access online journal, Climate of the Past.
The authors point out that paleo-temperature reconstructions are essential for distinguishing human-made climate change from natural variability, but historical temperature records are not long enough to capture pre-human-impact variability. Further, using conventional pollen- and land-based sediment samples as climate proxies can reflect confounding parameters rather than temperature, such as precipitation, humidity, evapo-transpiration and vegetation changes.
Or put more succinctly, our thermometer record is short and lousy and our proxy record is pretty damn poor too.
Then TallBloke also points at a couple of other links. Here’s the paywall:
https://www.sciencedirect.com/science/article/pii/S0012825216300277
Anthropogenic CO2 warming challenged by 60-year cycle
Author François Gervais
Abstract
Time series of sea-level rise are fitted by a sinusoid of period ~ 60 years, confirming the cycle reported for the global mean temperature of the earth. This cycle appears in phase with the Atlantic Multidecadal Oscillation (AMO). The last maximum of the sinusoid coincides with the temperature plateau observed since the end of the 20th century. The onset of declining phase of AMO, the recent excess of the global sea ice area anomaly and the negative slope of global mean temperature measured by satellite from 2002 to 2015, all these indicators sign for the onset of the declining phase of the 60-year cycle. Once this cycle is subtracted from observations, the transient climate response is revised downwards consistent with latest observations, with latest evaluations based on atmospheric infrared absorption and with a general tendency of published climate sensitivity. The enhancement of the amplitude of the CO2 seasonal oscillations which is found up to 71% faster than the atmospheric CO2 increase, focus on earth greening and benefit for crops yields of the supplementary photosynthesis, further minimizing the consequences of the tiny anthropogenic contribution to warming.
I found a non-paywall copy up here:
http://www.skyfall.fr/wp-content/2016/05/Earth-Science-Reviews_FG_2016-.pdf
So download your copy while you can…
A nice summary of other 60 year-ish cycle evidence in this link also from TallBloke:
http://appinsys.com/globalwarming/SixtyYearCycle.htm
So what are these “branched glycerol dialkyl glycerol tetraethers”?
Found that answer here:
https://agupubs.onlinelibrary.wiley.com/doi/full/10.1029/2010JG001365
From their Figure 2:
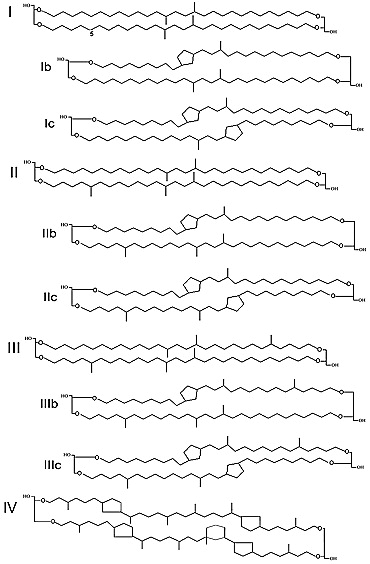
GDGTs
Strange things made in the membrane of various microbes in the water column that change with the temperature.
From the actual paper intro:
A cycle of period ~60 years has been reported in global mean temperature of the earth (Schlesinger and Ramankutty, 1994; Ogurtsov et al., 2002; Klyashtorin and Lyubushin, 2003; Loehle, 2004; Zhen-Shan and Xian, 2007; Carvalo et al., 2007; Swanson and Tsonis, 2009; Scafetta, 2009; Akasofu, 2010; D’Aleo and Easterbrook, 2010; Loehle and Scafetta, 2011; Humlum et al., 2011; Chambers et al., 2012; Lüdecke et al., 2013; Courtillot et al., 2013; Akasofu, 2013; Macias et al., 2014; Ogurtsov et al., 2015). This cycle and others of smaller amplitude were found to be correlated with the velocity of the motion of
the sun with respect to the center of mass of the solar system (Scafetta, 2009). This cycle is also in phase with AMO index (Knudsen et al., 2011; McCarthy et al., 2015). Section 2 will search for additional signatures of this 60-year cycle in major components and sensitive indicators of climate. The impact on climate of the CO2 emitted by burning of fossil fuels is a long-standing debate illustrated by 1637 papers found in the Web of Science by crossing the keywords[anthropogenic] AND [greenhouse OR CO2] AND [warming]
This is to be compared to more than 1350 peer-reviewed papers which express reservations about dangerous anthropogenic CO2 warming and/or insist on the natural variability of climate (Andrew,2014). The transient climate response (TCR) is defined as the change in global mean surface temperature at the time of doubling of atmospheric CO2 concentration. The range of uncertainty reported by AR5 (2013) is very wide, 1–2.5 °C. More recent evaluations, later than the publication of AR5 (2013), focus on low values lying between 0.6 °Cand 1.4 °C (Harde, 2014; Lewis and Curry, 2014; Skeie et al., 2014; Lewis, 2015). The infrared absorption of CO2 is well documented since the availability of wide-band infrared spectrometry (Ångström, 1900).
OMG! Actually talking about solar motion and AMO connections! Next thing you know they will discover the lunar cycle involvement and how tides are directly shifting the ocean and air flows as part of those celestial motions…
The intro then goes into a discussion of the IR spectra and transmission where it finds the approved models lacking and also finds that yes, Virginia, we have had a pause in temperature rises…
The controversy has reached a novel phase because, contrary to CMIP3 and CMIP5 warming projections (AR5, 2013), global mean temperatures at the surface of the earth display a puzzling « plateau » or « pause » or « hiatus » since the end of the last century (McKitrick, 2014). This hiatus seems to have encouraged climate modelers to refrain from exaggerated warming projections.
The paper is full of many such goodies. It goes on to find a large 60 year cycle effect and a very muted CO2 effect.
Skipping down to the summary:
Dangerous anthropogenic warming is questioned (i) upon recognition of the large amplitude of the natural 60–year cyclic component and (ii) upon revision downwards of the transient climate response consistent with latest tendencies shown in Fig. 1, here found to be at most 0.6 °C once the natural component has been removed, consistent with latest infrared studies (Harde, 2014). Anthropogenic warming well below the potentially dangerous range were reported in older and recent studies (Idso, 1998; Miskolczi, 2007; Paltridge et al., 2009; Gerlich and Tscheuschner, 2009; Lindzen and Choi, 2009, 2011; Spencer and Braswell, 2010; Clark, 2010; Kramm and Dlugi, 2011; Lewis and Curry, 2014; Skeie et al., 2014; Lewis, 2015; Volokin and ReLlez, 2015). On inspection of a risk of anthropogenic warming thus toned down, a change of paradigm which highlights a benefit for mankind related to the increase of plant feeding and crops yields by enhanced CO2 photosynthesis is suggested.
I strongly recommend a download and careful reading of the paper.

A lecture by Prof. Gervais presenting his findings with english translation
Pingback: CO2 Not So Much, 60 Year Cycle Paper Actually Got Published – Climate Collections
This was up at WUWT last Wednesday, 9th.
There are some interesting comments; also many not.
I thought it interesting, still do, and can wait for further activities.
Thanks for the summary here.
If anyone cares: I found a site to monitor the snow in mid-CA mountains.
HELL HOLE (HLLC1)
Lat: 39.069711°NLon: 120.419886°WElev: 5240ft.
The first paper was a result of doctoral students research advised by Raymond Bradley. Bradley was a co-author of the Mann hockey stick which got rid of the Medieval Warm Period and the Little Ice Age. Bradley’s students rediscovered the MWP and the LIA. :)