
Having been under nearly continuous rain for a week or two, I’d really like the present “drought” to end before it drowns me.
The Drought View:
We saw an earlier version of this map in the prior Flooding Drought posting.
This is an “updated” version that doesn’t look a whole lot different. From:
http://droughtmonitor.unl.edu/

8 March 2016 “Drought” monitory page
Note that the angry deep red continues throughout the northern Central Valley and up into the mountains. Note, too, the “abnormally dry” yellow over east Texas and Louisiana where the current news is of flooding of Biblical Proportions rather than drought.
Now the question I have is simple: IF we are supposedly in a drought of Biblical Proportions, just WHY am I suffering from so much rain and just WHY are the stream gauges running near full? Can’t we call it an end to the drought when we’re flooding? Here’s the hazards map from http://www.nws.noaa.gov/largemap.php

Weather Warnings and Hazards 13 March 2016
The light salmon color is winter storm warnings while the greens are degrees of flooding.
Here’s the Weather Channel weather for the area:

Weather Channel West Coast Storms
Just so you can see that it isn’t just one source saying we’re all wet. And will continue to be.
Oh, and just for grins, here’s the Stream Guage readings. Note that the green is normal(ish) while the blue is way too much water at greater than 90th percentile. From: http://waterdata.usgs.gov/nwis/rt/

California Stream Gauges Real Time 14 March 2016
Look carefully and you can find some drought down near Los Angeles (that is in a natural desert). But pretty much everything in the northern 1/2 is flooding (with a few merely “normal” spots…) while even in the South, there are a bunch of ‘normal green’ dots.
NOAA lets you make custom time interval maps from the bottom of this page: http://water.weather.gov/precip/. Here’s first, the 2015 full year map, then the present month map:

2015 USA Precipitation Percent map
Note that grey is normal to 110% of normal, while yellow into deep red goes to zero percent, and the greens blue dark blue to to 300% and the purple bands goes to 600% of normal. While I might expect “normal” to be from, oh, 90%-110% or 95%-105%, they think you can only be normal if you are over 100%… Here’s January of this year:

USA precipitation percents January 2016
March is not yet ready, and while February was dry, March has been worse than January as we’ve been having our “Atmospheric River” events again. (They happen every few years…).
So my questions are simple. IF Global Warming was supposed to be causing the drought in Texas, how did it also cause the 2015 excess rain in Texas? IF Global Warming is supposedly causing our present “drought” in California, how come the stream gauges are at 90th percentile and we’re under storm watches and warnings with huge snowfall in the Sierra Nevada? Could it be it’s all just our normal dry-then-wet weather cycles?
From: http://www.cnrfc.noaa.gov/awipsProducts/RNOWRKCLI.php
I’ve bolded a bit. Note that PON is percent of normal for that period, so the first PON is % of normal for this water year to date:
California Climate Station Precipitation Summary

SRUS56 KRSA 140200
RR4RSA

CLIMATE STATION PRECIPITATION SUMMARY
NATIONAL WEATHER SERVICE / CALIFORNIA NEVADA RFC / SACRAMENTO CA
700 PM PDT SUN MAR 13 2016

 WARNING!! THIS PRODUCT IS AUTOMATED AND UPDATED ONCE PER DAY
           THIS PRODUCT CONTAINS PRELIMINARY CLIMATE DATA

 DATA REPRESENT PRECIPITATION ENDING AT 500 PM PDT ON 03/13/2016


                           SINCE    OCT 01-       OCT 01-       OCT 01-  OCT 01-
                           MIDNITE  MAR 13        MAR 13        MAR 13   SEP 30
CLIMATE STATION            TOTAL    2016     PON  2015     PON  NORMAL   NORMAL
-------------------------  -------  ------------  ------------  -------  -------

...NORTHERN CALIFORNIA...

MEDFORD OR                    0.12   16.52   129   11.42    89    12.84    18.35
KLAMATH FALLS OR              0.19    8.56    96    8.88    99     8.96    14.96
CRESCENT CITY                 0.92   60.27   127   31.03    65    47.53    64.03
EUREKA                        0.38   41.68   137   24.90    82    30.49    40.33
UKIAH                         1.05   33.19   112   22.95    77    29.63    37.35
MONTAGUE / SISKIYOU           0.14   11.95    99    9.99    83    12.08    18.47
ALTURAS                       0.11    9.27   113    5.65    69     8.22    14.17
MOUNT SHASTA CITY             0.74   35.27   108   30.25    93    32.59    43.21
REDDING                       0.35   30.13   113   20.32    76    26.59    34.62
SACRAMENTO EXEC AIRPORT       0.23   14.36    97   13.42    91    14.77    18.52
SACRAMENTO - CSUS             0.31   14.54    90       M     M    16.13    20.27
BLUE CANYON AIRPORT*          3.30   55.50   114   29.91    61    48.82    64.62
SANTA ROSA                    0.71   29.20    98   22.89    77    29.85    36.28
SAN FRANCISCO                    M       M     M       M     M        M    23.65
SFO INT'L AIRPORT             0.77   16.11    94   14.99    88    17.08    20.65
OAKLAND AIRPORT               0.53   14.60    87   13.24    79    16.71    20.81
LIVERMORE                     0.39   13.09   103   12.01    94    12.74    15.71
MOUNTAIN VIEW - MOFFETT       0.30   11.36    97   12.57   107    11.76    14.68
SAN JOSE                      0.50   12.71   104   11.84    97    12.19    14.90
Since in Northern California our “water year to date” (that starts in October) is pretty much absolutely normal or above average rainfall: Just why in hell are we being told “normal to flooding” is a drought and we have a map covered in red for severe drought? Note the number of “above 100” in that first PON column.
Central California is about the same:
...CENTRAL CALIFORNIA...

STOCKTON                      0.45   13.21   120    9.44    86    11.04    14.06
MODESTO                       0.79   13.36   133    9.35    93    10.07    13.11
MERCED                        0.51   10.88   114    6.01    63     9.53    12.50
MADERA                        0.39   11.28   121    4.26    46     9.33    12.02
FRESNO                        0.17   12.87   149    4.59    53     8.63    11.50
HANFORD                       0.06    7.41    95    4.05    52     7.78    10.10
BAKERSFIELD                   0.00    3.91    79    4.53    92     4.92     6.47
BISHOP                        0.00    2.00    53    0.73    19     3.80     5.18
SALINAS                       0.39   12.61   125    8.77    87    10.07    12.83
PASO ROBLES                   0.02    7.90    77    8.05    78    10.26    12.78
SANTA MARIA                      T    7.89    71    6.70    60    11.08    13.95
Though at the far southern end of it, you start to get a bit dry. There is a drought in Southern California, but that’s a far far smaller area than shown on the “Drought Maps”.
...SOUTHERN CALIFORNIA...

SANDBERG                      0.00    6.14    60    6.81    67    10.20    12.33
PALMDALE                      0.00    4.09    63    3.71    57     6.50     8.30
LANCASTER                     0.00    3.67    61    4.32    72     6.01     7.38
SANTA BARBARA                 0.00    9.65    67    8.82    61    14.36    17.76
CAMARILLO                     0.00    5.41    42    8.01    61    13.03    15.22
BURBANK - BOB HOPE               T    7.21    51    7.03    50    14.06    17.31
LAX INT'L AIRPORT             0.00    6.31    59    6.71    63    10.69    12.82
LOS ANGELES / USC             0.00    6.54    53    7.40    60    12.26    14.93
LONG BEACH                    0.00    4.76    46    6.86    67    10.29    12.26
FULLERTON                     0.00    5.05    43    5.33    46    11.70    13.88
IRVINE - JOHN WAYNE           0.00    4.61    41    5.74    51    11.28    13.33
OCEANSIDE                     0.00    6.07    55    5.88    53    11.12    13.66
RAMONA                        0.00   11.35    91    7.44    59    12.54    16.04
SAN DIEGO - LINDBERGH         0.00    6.83    82    6.50    79     8.28    10.34
ONTARIO                       0.00    6.09    49    8.43    68    12.38    15.04
RIVERSIDE                     0.00    4.69    46    4.78    47    10.23    12.40
PALM SPRINGS                  0.00    2.47    57    2.09    48     4.35     5.74
THERMAL                       0.00    1.63    68    0.77    32     2.38     3.20
CAMPO                         0.00    7.34    62    6.35    54    11.81    15.73
BARSTOW - DAGGETT             0.00    1.43    55    1.80    69     2.62     4.06
NEEDLES                       0.00    1.40    48    2.40    82     2.94     4.62
But not Nevada until you get down to the southern tip near Las Vegas (also red and yellow on the “drought” map)
...NEVADA...

RENO                             T    6.35   132    2.92    61     4.81     7.40
WINNEMUCCA                       T    6.83   157    3.79    87     4.35     8.28
ELKO                             T    7.08   130    2.78    51     5.44     9.91
EUREKA NV                     0.00    6.42   157    2.02    49     4.09     9.00
ELY                           0.00    7.30   177    2.05    50     4.12     9.76
TONOPAH                       0.00    4.83   203    0.92    39     2.38     5.24
DESERT ROCK - MERCURY         0.00    4.33   130    2.49    75     3.34     5.93
NORTH LAS VEGAS               0.00    1.76    52    2.28    67     3.39     5.37
LAS VEGAS - MCCARRAN          0.00    1.96    73    1.99    74     2.68     4.19
KINGMAN AZ                    0.00    2.86    61    4.83   103     4.67     8.39
YUMA AZ                       0.00    0.63    34    0.94    51     1.86     3.30

--------------------------------------------------------------------------------
PON IS THE PERCENT OF NORMAL FOR THE PERIOD
NORMALS ARE 1981-2010 AVERAGES
So we’ve got over 150% to 200% of normal rainfall and it’s a drought? Really?
Look, I’m sympathetic to the LA Folks having a water shortage, they live in a natural desert with sporadic rainfall. But that in no way justifies calling what is happening in the northern half of the State (or of Nevada) a “drought” when it just isn’t.
The “Drought” Monitor Map is broken, tells lies and loves Porkies, and needs to be ignored, thrown out, or fixed.
IMHO it is just another propaganda tool. Then again, maybe I’m just grumpy. Being kept inside for a few weeks from excessive rains can make a fellow feel grumpy when he’s being told it is a drought and he can go mow the lawn… (that is growing profusely without being watered, watering we’ve been told not to do since we’re in a “drought”…with slogans like “Brown is the new Green” on ex-lawn posters…)
Update
Down in comments, this graph was linked. It illustrates the “issue” rather clearly:
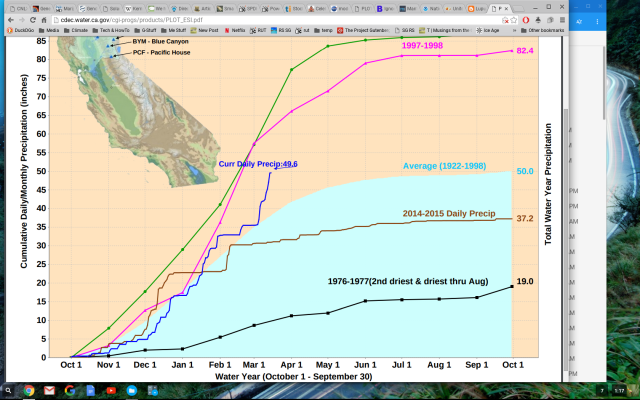
Northern California Precipitation vs prior high and low extremes 14Mar2016
Here we are in an above average rainfall situation, and the “drought monitor” is saying we are in a severe drought. That’s just wrong.

I am curious what constitutes a “severe” drought as defined in Imperial Valley when their “normal” rainfall is only 3 inches to begin with?
Stalin hijacked science after nations and national academies of science were united on 24 OCT 1945 to hide from the public the source of energy that destroyed Hiroshima & Nagasaki on 6 & 9 AUG 1945:
https://stevengoddard.wordpress.com/2016/03/14/erasing-the-100-consensus-2/#comment-575126
Cui bono?
@Philjourdan:
Instead of raining 2 days in the year, it only rains one day…
First climate scientist arrested for fraud:
http://junkscience.com/2016/03/climate-scientist-arrested-for-fraud/#respond
I sincerely wish we could have avoided this development.
Oliver K. Manuel
Blaming Global Warming is the new’Act of God”.
Nothing has changed, except the choice of words.
Same conmen same old scam.
Lake Shasta is now 100 percent of normal, gaining 4 feet per day at 70, 000 cubic feet per second, (states largest reservoir) Oroville is aging 6 almost 6 feet per day. Melones is doing poor because they keep releasing releasing water. The snow pack is now about 100 percent of normal with higher then normal water content.
Damm phone typos
Maybe you could
1) park your car(s) on your lawn
2) pour some soap over them (with some phosphates in it)
3) let the rain wash and rinse away and
4) move the cars back to where they were
This will have a triple benefit,
get your cars clean,
fertilize your lawn (at least a little bit)
and drown the varmints that would like to munch through your lawn
Not sure if the chemical balance would be OK, or if the “whites whiter, brights brighter” phosphates
would help your cars’ paint, but it’s just a thought.
Funny how people don’t think that weather works in cycles anymore. Seems like Farmers Almanac always referred to historical data… sigh…
Well, the last series of rains have blessed us with over 12inches of water here above Chico. After a over a week of dismal wet and fog we have SUN! all Day. Kind of nice, I was getting cabin fever. Looks like the Reservoirs are nearly full and the mountains full of wet snow and are leaking from every crevice, streams and rivers running full. Hillsides covered with lush green growth. Spring has sprung with blooming things everywhere. My part of California looks to be wet. Maybe wetter then normal and a bit warmer then usual…pg
Great sunny weather here in Missouri now too, as the National Academy of Sciences begins to fight for survival as a credible organization after the next presidential election:
http://www.nap.edu/catalog/21852/attribution-of-extreme-weather-events-in-the-context-of-climate-change
Their attempt to attribute extreme weather to human-caused climate change is not credible because NAS studiously avoided addressing precise experimental data and observations that show the Sun’s core is the pulsar remnant of a supernova that:
i.) Made our chemical elements,
ii.) Birthed the solar system 5 Ga ago, and
iii.) Sustains every atom, life and planet in the solar system today:
http://crescopublications.org/pdf/ASSOA/ASSOA-2-005.pdf
@Jeff:
Sounds great except:
Phosphates have been banned from soap in California (so no fertilizer)
It has been made illegal to wash your own car (honest!) even if you park it on the lawn to use the water twice. You MUST go to a car wash that MUST use recycled water with waste capture (and recycle) or go dirty.
In many places, it is simply illegal to park on your own lawn. Oil, “waste water” and soap are NOT supposed to end up in your lawn or in the “storm drains” that the lawn sheds water toward.
You are supposed to LET your lawn die, not help it live. Many folks have replaces lawns with rocks and / or “native plants” (i.e. weeds). One neighbor has an astroturf bachi ball court now…
Sorry, you clearly are not in touch with the Right Think of The Peoples Republic Of Kalifornia…
( I’d like to put a smiley or a ;sarc/ on this, but I can’t. It’s all straight truth. Sigh. Guess why I’m in the process of moving everything to Florida… )
@All:
Heard on the news tonight that the Drought Area of Louisiana (that yellow splotch) is expected to have a river crest at the highest EVER recorded and a few feet above flood stage sometime tomorrow… Not just a flood, a RECORD flood Ever! But that’s a drought for you…
Short-term drought indicator blends focus on 1-3 month precipitation. Long-term blends focus on 6-60 months. So, if you have drought three years in a row followed by two years of ‘deluge’, the average will still be drought. Or something else terrible and climatic.
That’s all I can get from the angry deep red.
One more thing…
Regarding the first graph- All of the ‘L’s are on the left side and the ‘S’s are on the right side (with only one ‘SL’). Who draws a garph that combines both Long and Short term blends on the same graph? Why not show the short term blend for Kali and the long term trend for N.D.? Broken by design?
Here is the short term blend for Conus…
http://droughtmonitor.unl.edu/MapsAndData/ChangeMaps.aspx
@E.M. – LOL. Yea.
Yep, even the graph shot up over the last few days http://cdec.water.ca.gov/cgi-progs/products/PLOT_ESI.pdf
@Martin:
Ooooh! I’d forgotten where to get that graph… Maybe I’ll add it to the posting as it makes the case much more clearly (having all of wettest year, driest year, and averages for comparison).
@Sera:
Yeah, makes you wonder a bit. If you search a space for any interval in which there has been below the average rain, and graph that, with a different time marker, you “harvest” more dry intervals to mark. January was a flood, but February backed off and we dried out, so an S-drought gets posted since it didn’t drown us twice… but if it rained normally all year, put up an L-drought ’cause it didn’t rain much 2 years ago… Does seem contrived by design.
Cliff Mass ( weather prof at Univ. Washington) put this up: http://cliffmass.blogspot.com/2016/03/drought-buster-hits-california.html
He had the same question.
You need a weather rock, EM.
And pg, are you up around Magalia? I worked in Stirling City in 1968, and the folks moved to Magalia about 1978. Good times.
For anyone interested, check Weatherbell.com late on Saturday for Joe Bastardi’s Saturday update. He covers a lot of the upcoming patterns.
@Terry Jay; Midway between Magalia and Forest Ranch on Doe Mill Ridge…pg
The ‘S’s match the 3 month blend. If you need to go back further, you are going to love this…
http://droughtmonitor.unl.edu/MapsAndData/ComparisonSlider.aspx
Drought can be defined in several conflicting ways. Ground water height is one, river levels and snow caps another, and top soil moisture a third. What is exceptional is also a matter of definition.
IMO NOAA must have a consistent way of defining drought, but it does not need to be an intuitive way.
@Wert:
I can define a frog as a furry mammal that eats nuts and lives in trees, too, but it would be more squirrelly than informative.
When my “drought” includes flooding and above normal rainfall, it’s too squirrelly for me.
Pingback: Bring Back Lake Tulare? | Musings from the Chiefio