
The title is a bit of a play on words. In common U.S. English, there’s a frequent phrase that came, I think, from High School Sports (and eventually made it into movies). In one movie, it involves cats vs. dogs. “Cats Rule, Dogs Drool”.
But I could have causality backwards here. Perhaps the movie came first?
At any rate, this posting has two ‘themes’, if you will. First, the Tropopause dominates what happens (i.e. it “rules” while the rest of the atmosphere is along for the ride). Second, that there are things that drive the tropopause, just like there are “rules of the road”, there are physics rules that tell us how the tropopause will behave. Two sides of one coin. What are the rules that drive the tropopause, and why does that dominate the meaning of the air?
Atmosphere, Stratosphere, Mesosphere, Troposphere
My kingdom for a sphere…
We all know what a sphere is. It is a nice round ball. Radius substantially equal in all directions. The use of “sphere” in all those terms about the air layers of our planet is a lie. I’d like to make it prettier than that, but I can’t. “Reality just is. -E.M.Smith”. It is a pernicious lie that invades our understanding and corrupts the ability to see what is really happening. Yet the constraints of language force me to use those words. OK, but at least we can set a “That is a lie” marker on the “sphere” part of the words. From this point forward, when you see “Stratosphere” think “That’s a ‘polite lie’ and it’s really StratoBand”.
Why say that? Because if you let your mind be ‘trained’ into thinking “sphere” you will never see the reality, or at best see it dimly hiding behind a mental fog of wrong definition. (BTW, this is a technique I frequently use to ‘keep a tidy mind’. When I find the language is lying to me, I ‘flag it’ and create a new internal thought marker – word if you like – to link to that word that ‘clarifies’ it. From that point on, when reading that word, I hear a faint echo of the ‘synonym’ with the right truth in it… Rather like a Senator saying “My Esteemed Colleague” while thinking “That Evil Bastard” ;-)
For the StratoBand in particular, we have a clear visible case that demonstrates the lie in Stratosphere. During the winter, the polar TropoBand is essentially zero and the StratoBand extends to the surface. In essence, the TropoBand ought to be seen as a 3/4 sphere (or so) that wobbles back and forth from one end of the planet to the other. Similarly, the StratoBand ought to be seen as a 3/4 sphere (or so) that is touching one pole in a polar vortex and rising up, spinning as it goes, spreading out toward the other pole – thinning all the way. As the year progresses, this spinning vortex like band shifts from anchored at one pole to anchored at the other (so at some mid-point might well be a momentary sphere…)
You can see that ‘shifting’ in this movie of how net radiation changes over time.
Now we have a much more accurate dynamic mental model of what’s going on. No longer thinking in terms of fixed onion layers, but in terms of a spinning elastic band that surges back and forth from pole to pole. Rising and falling as it goes. That’s more nearly what really happens.
For the Tropo”sphere” it’s even more complex. It rises and falls in bands as it goes from equator toward the warm pole. These are the “Hadley Cells” and “Ferrel Cells” and “Arctic Cells”. How can something be a sphere when it is divided into at least 3 major zonal bands, each of different heights and with different dynamics, with discontinuities between them, and with a major ‘wobble’ back and forth between poles? We really have 3 different TropoBands to think about (or think in terms of).

Tropospheric Bands of Activity
(Details on origin below in end notes.)
OK, given that context:
What IS the Tropopause?
In the various definitions, you get a confusing mush of things. It’s the point where the lapse rate goes from positive to negative. Or it’s the place where the water vapor runs out and ozone begins. Or it’s a particular lapse rate. Or….
All well and good. But…
What does the Tropopause MEAN?
Every physical thing has some meaning. Some hidden truth. Just slapping a definition on something and ‘moving on’ rarely illuminates that meaning. Like saying “Bob is a cop”. OK. We know a little something about Bob. But is he a Narc? A homicide detective? Did he become a cop for the pension or because he likes adrenalin? What is the ‘inner meaning’ of “Bob The Cop”? For the Tropopause we hear “it is where the troposphere ends and the stratosphere begins. As though it is just some definitional artifact of two nice round ball layers.
But it isn’t.
First off, since the StratoBand comes to near ground level in polar winter, so must the TropoPause. It, too, is complicated. Second, since the TropoBandS have various heights, the TropoPause must also. Finally, since a variety of physical properties / markers change AT the TropoPause, it must be indicating something interesting about “what changed?”.
OK, hopefully I’ve gotten the ‘right word think’ into your head… From here on out, I’m less likely to actually force use of words like “StratoBand”… I’m depending on you to think that on your own when you see “Stratosphere”… OK?
https://en.wikipedia.org/wiki/Stratosphere
Within this layer, temperature increases as altitude increases (see temperature inversion); the top of the stratosphere has a temperature of about 270 K (−3°C or 29.6°F), just slightly below the freezing point of water. The stratosphere is layered in temperature because ozone (O3) here absorbs high energy UVB and UVC energy waves from the Sun and is broken down into atomic oxygen (O) and diatomic oxygen (O2). Atomic oxygen is found prevalent in the upper stratosphere due to the bombardment of UV light and the destruction of both ozone and diatomic oxygen. The mid stratosphere has less UV light passing through it, O and O2 are able to combine, and is where the majority of natural ozone is produced. It is when these two forms of oxygen recombine to form ozone that they release the heat found in the stratosphere. The lower stratosphere receives very low amounts of UVC, thus atomic oxygen is not found here and ozone is not formed (with heat as the byproduct). This vertical stratification, with warmer layers above and cooler layers below, makes the stratosphere dynamically stable: there is no regular convection and associated turbulence in this part of the atmosphere. The top of the stratosphere is called the stratopause, above which the temperature decreases with height.
The stratosphere is simply the place where convection is not important. The place where radiation is the dominant form of heat transfer and where radiative physics matters.
But it’s worse than that. The wiki (and I’ve seen it other places too, so it’s not just “wiki-bias”) says, in essence, that the lower bound of the StratoBand is set by where the UV runs out. Repeating, for emphasis:
The mid stratosphere has less UV light passing through it, O and O2 are able to combine, and is where the majority of natural ozone is produced. It is when these two forms of oxygen recombine to form ozone that they release the heat found in the stratosphere. The lower stratosphere receives very low amounts of UVC, thus atomic oxygen is not found here and ozone is not formed
But we know that during the Polar Winter the bottom of the Stratosphere is lower and at the Equator it is higher. Clearly “ozone formation” and UV anything are greatest in the equatorial summer and lowest in the polar winter. By the reasoning that “ozone done it”, the Stratosphere bottom ought to be LOWEST in the equatorial summer and highest in the polar winter. Besides, as someone with “The Redhead Gene”, I can assure you that a LOT of UV makes it to ground level. Tropical summer, I’ve got 15 to 20 minutes tops at noon, then I’m lobster time…
So that ozone formation / UV description is a RESULT in the Stratosphere, not a LIMIT on the lower bound altitude.
https://en.wikipedia.org/wiki/Troposphere
The troposphere is the lowest portion of Earth’s atmosphere. It contains approximately 80% of the atmosphere’s mass and 99% of its water vapor and aerosols. The average depth of the troposphere is approximately 17 km (11 mi) in the middle latitudes. It is deeper in the tropics, up to 20 km (12 mi), and shallower near the polar regions, at 7 km (4.3 mi) in summer, and indistinct in winter.
[…]
The word troposphere derives from the Greek: tropos for “turning” or “mixing,” reflecting the fact that turbulent mixing plays an important role in the troposphere’s structure and behavior. Most of the phenomena we associate with day-to-day weather occur in the troposphere.
[…]
The chemical composition of the troposphere is essentially uniform, with the notable exception of water vapor. The source of water vapor is at the surface through the processes of evaporation and transpiration. Furthermore the temperature of the troposphere decreases with height, and saturation vapor pressure decreases strongly as temperature drops, so the amount of water vapor that can exist in the atmosphere decreases strongly with height. Thus the proportion of water vapor is normally greatest near the surface and decreases with height.
In short, the Troposphere is where convection and evaporation / condensation dominate. Driven by ground heating. Radiation simply does not matter here. Any ‘ground heat’ is rapidly taken up by convection and evaporation / precipitation, lofted to the height where radiation takes over, and dumped. We see that every day with the daily temperature cycling in response to 0 to 1400 (ish) W/m^2 solar flux variations.
Now we can start to see what the Tropopause is telling us. It is telling us the point at which convection and precipitation have ‘done their job’ and moved the heat. It is telling us exactly where radiative physics can take over. Where the ‘heat engine’ has run down and mass movement runs out of energy.
A higher tropopause means more heat is landing on the surface. A lower tropopause means less heat is landing on the surface. It’s really that simple. We can directly measure surface heat via tropopause height. We can even see this in no uncertain terms. At the arctic in winter, there is no surface heating. The tropopause crashes into the ground. At the Equator there is strong surface heating. The tropopause is at the greatest height. Yet there is more… Thunderstorms have what is called “overshoot”. (Another broken term, IMHO). The surface heating is so large that a huge run of wet air shoots up and crashes right on through where the tropopause layer ‘ought’ to be. In my view of things, it is simply locally lifting the tropopause at the point were there’s a bit more convective / precipitation work to do to dump some extra heat to the radiative zone… Again, directly reflecting the heat load at the surface below. (This is confirmed, IMHO, by the way storms leave a cool track in their wake that is lacking in convection / precipitation…)
This has implications.
https://en.wikipedia.org/wiki/Tropopause
Since the tropopause responds to the average temperature of the entire layer that lies underneath it, it is at its peak levels over the Equator, and reaches minimum heights over the poles. On account of this, the coolest layer in the atmosphere lies at about 17 km over the equator. Due to the variation in starting height, the tropopause extremes are referred to as the equatorial tropopause and the polar tropopause.
I think the Tropopause guys need to go talk to the Stratosphere guys and “give them a learnin’…” ;-)
Recently, the sun ‘went quiet’ and the atmospheric height dropped. IMHO that is a direct measurement of the change in net surface heating. In response to lower heat input, the convective / precipitation process shortened. In response to lower levels of UV (dramatically lower) the Thermospheric temperature dropped and most likely ozone formation dropped too.
This all changes the ‘race condition’ between water warmth and stratospheric heat dumping. More Infrared and visible light is reaching the surface of the oceans. That means more absorbed in the surface layer to evaporate water. Less UV means less is reaching deeper parts of the ocean to warm the depths. We ought to have less subsurface heat trying to get out of the oceans. Fewer warm pools. More cool surfaces. The ENSO cycle will tend to more cold states and fewer warm states.
And it is my assertion we could measure all this activity ‘net-net’ via looking at the height of the tropopause.
But WHY doesn’t radiation matter in the Troposphere?
It can’t all just be due to a lot of convection and rain, can it?
Well, ‘yes and no’…
We’ve all had the experience of being out on a ‘cold clear night’ and having felt the heat radiating off to space. Especially easy to feel in the desert. And that is your first clue. Under a midwestern cloudy sky on a muggy summer evening, you don’t get much relief. Not until some rains come. When there is enough water, it is water vapor and clouds that dominate. Over most of the planet, there’s always enough water. 70% of the surface (or so) IS water. On land, lots of that has water too. Either in lakes, streams, and snow; or as damp leaves of vegetation. The few places that are not dominated by water stand out as ‘special’. Deserts and “Mediterranean” climate zones. California is one of those. We get cold on summer nights.
“Why” is pretty simple. We have cold water ‘up wind’ of us here in California. That squeezes the water out of the air. Deserts are worse. Nevada gets our already dry air and lifts it up high (wringing a bit more water out on the mountains as snow) and giving Nevada a “high cold desert”.
In some places, that equatorial lifted and dried air has to come back down. At the edge of that equatorial band. Where that air descends, we get a band of desert. Just run a line around the globe and you get deserts at the two latitude bands each side of the tropics. (Where the air lifted in the equatorial zone comes back down, dried by being rained out during the rise.) Chile in South America. Mojave in the north. Sahara in North Africa. Namib and Kalahari deserts in southern Africa. Gobi in China, the ‘outback’ in Australia. It takes two things. The right latitude for those descending dry air flows, and distance from water dampened air. Not far enough from water, you get a ‘Mediterranean’ climate instead. (Found, not surprisingly, right next to the deserts in California, Chile, Australia, The Mediterranean, etc. etc… right next to the water…)
So our first clue is that ‘water matters’.
In the stratosphere there is very little water.
From that tropopause wiki:
It is also possible to define the tropopause in terms of chemical composition. For example, the lower stratosphere has much higher ozone concentrations than the upper troposphere, but much lower water vapor concentrations, so appropriate cutoffs can be used.
In essence, when in a dry desert or frozen arctic, and feeling that radiative heat loss, you are getting a small sample of the Stratospheric regime. THE place where radiation really matters. Since the deserts are a very minor part of the planet surface, they do not dominate our heat gain / loss profile. Since the polar regions are only really tropospheric part of the year, and have poor insolation most of the year, they don’t dominate our heat gain, but do have a lot to do with our heat loss. And it is very clear that the troposphere is the place where convection and the water cycle control things. They fiercely dominate and can be directly observed in the tropopause height and changes.
This movie shows the movement of the tropical water vapor dominated zone as the sun track moves and the related cloud cover changes. The desert zones show up very nicely on the cloud cover movie.
Why This Chart Doesn’t Matter
And that is why this, often waved about and touted, graph is just irrelevant:
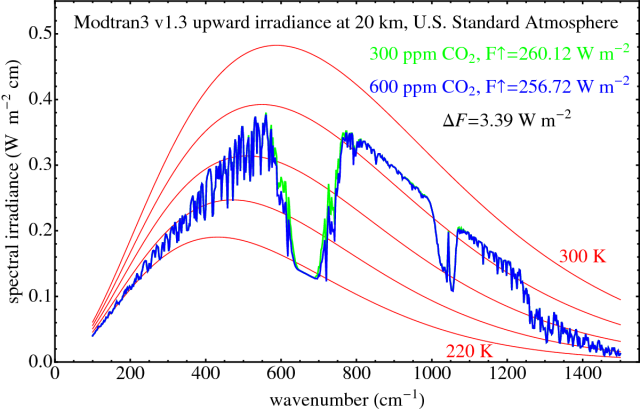
Modtran Radiative Forcing on CO2 Double
Look carefully at that graph. Notice all those dips and dives, the “CO2 blocked” band and all the rest? Notice that bright green line with the 3.39 W/M^2 added radiative blocking?
Looks pretty grim, doesn’t it. We’re going to be blocking up that radiative window by 3 Watts and slightly shifting the atmospheric transmissivity of that CO2 region. Oh The Horrors!
Now read the title across the top. “Modtran”. It’s a computed model. NOT measured heat flow at that level. “20 km”. It is for a fixed height. From the tropopause wiki:
The troposphere is one of the lowest layers of the Earth’s atmosphere; it is located right above the planetary boundary layer, and is the layer in which most weather phenomena take place. The troposphere extends upwards from right above the boundary layer, and ranges in height from an average of 9 km (5.6 mi; 30,000 ft) at the poles, to 17 km (11 mi; 56,000 ft) at the Equator.
The difference between 20 km and 17 km, especially at the equator where there is a lot of ‘overshoot’ going on from thunderstorms, is just not very significant. The bulk of the air density is in the lower dozen km and that’s where the bulk of the absorbing is going on.
In essence, they are mostly computing the radiation transmissivity of the Troposphere where convection and the water cycle are moving the heat. Where any net change in radiation will be compensated for by more convection, more water transport, a higher tropopause, or any / all of the above. Changing the CO2 transmissivity profile of a band of thunderstorms is just not relevant. It might cause some deserts to be a bit less cold at night, but won’t do anything at all for a polar winter.
Why no impact on a polar winter?
Because the Stratosphere RADIATES the heat away and the stratosphere is just about at the ground in a polar winter and without any water vapor in the way to close that part of the spectral window.
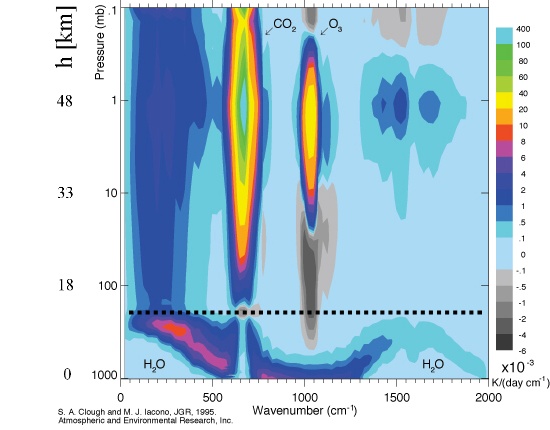
Stratosphere radiation by species
3. Stratospheric cooling rates: The picture shows how water, cabon dioxide and ozone contribute to longwave cooling in the stratosphere. Colours from blue through red, yellow and to green show increasing cooling, grey areas show warming of the stratosphere. The tropopause is shown as dotted line (the troposphere below and the stratosphere above). For CO2 it is obvious that there is no cooling in the troposphere, but a strong cooling effect in the stratosphere. Ozone, on the other hand, cools the upper stratosphere but warms the lower stratosphere. Figure from: Clough and Iacono, JGR, 1995; adapted from the SPARC Website. Please click to enlarge! (60 K)
The original of this image is from some paper linked to by the discussion of things here:
http://www.atmosphere.mpg.de/enid/20c.html
It goes on at some great length about how Green House Gases increase the radiative cooling of the Stratosphere. They are throughly convinced that stratospheric cooling is the Evil Twin of tropospheric warming, showing that GHGs are critical to both (so by implication, cooling in the stratosphere endorses warming troposphere). Completely missing the point that the troposphere is dominated by water and convection, so more heat in just means faster transport up. Yet the graph is useful and the discussion is interesting.
The caption reads:
3. Stratospheric cooling rates: The picture shows how water, cabon dioxide and ozone contribute to longwave cooling in the stratosphere. Colours from blue through red, yellow and to green show increasing cooling, grey areas show warming of the stratosphere. The tropopause is shown as dotted line (the troposphere below and the stratosphere above). For CO2 it is obvious that there is no cooling in the troposphere, but a strong cooling effect in the stratosphere. Ozone, on the other hand, cools the upper stratosphere but warms the lower stratosphere. Figure from: Clough and Iacono, JGR, 1995; adapted from the SPARC Website. Please click to enlarge! (60 K)
First, look at that left hand lower edge. See that big red spot? That’s water, dumping heat like crazy at the top of the troposphere. At a height that is determined NOT by that nice flat dashed line of tropopause, but directly by the amount of heat that needs to be dumped! Once again we have a ‘static scored’ model in a dynamic real world. More heat at the surface means more and stronger convection, more and stronger evaporation, and a bigger red spot higher up that graph! Remember that tropical storm “overshoot”? Not seeing it on this graph, are we?… Surges of heat would lead to surges of water across that dotted tropopause line and into the lower stratosphere. That is what we know actually happens.
Now look over at that large orange / yellow / green “cats eye” in the stratosphere that is the CO2 signature. Look directly below it. See that basically empty band of light blue? That is a direct reading on CO2, and it shows that the CO2 is just not doing anything that matters in the troposphere.
From that point, as you move to the right below the tropopause, you find water once again radiating at height, but not as much, in an even larger wavenumber (shorter wavelength). The overall message of this graph is just that in the troposphere, water is everything and CO2 is nothing. We can also add to this graph that convection and evaporation / condensation are major processes in the troposphere and this radiative model isn’t really all that important for surface cooling at all.
In the stratosphere we see some cooling from water vapor, so, little as there is up there, it still does something. However, THE largest blobs of cooling color come from CO2 and ozone. Adding CO2 to the atmosphere causes more radiative heat loss from just those parts of the atmosphere that do radiative heat loss, and does nearly nothing in that part of the atmosphere dominated by convection and evaporation / precipitation. Warming of the surface of the earth increases convection, evaporation, and water transport, and deposits that water and heat higher in the sky; so will dump more heat into the stratosphere (and perhaps more water vapor too … enhancing that water radiative part).
In short, the system is dynamic and has a convection driven lower layer, with a radiative driven upper layer. More CO2 means more radiative heat loss, not less. THAT is why the stratosphere has been cooling (though the upper atmosphere has dropped more on the loss of UV in the solar funk.)
During this solar downturn, the loss of UV overall, and loss of penetrating UV at the ocean surface, has resulted in a lower atmospheric height, and dropping sea temperatures. Soon to show up in lower land surface temperatures. (The snow last year was bad. It will get worse.) Eventually we will re-equilibrate with lower sea temperatures, lower evaporation rates, and lower precipitation rates, with a lower tropopause height. AFTER we dump the last 30 years worth of warm cycle ocean heat.
Along the way, a very cold stratosphere, dropping down the winter Polar Vortex, will cause a fairly strong warm / cold range between poles and the equator. That will cause a ‘loopy jet stream’ as the blobs of cold arctic air slide south and plenty of winter storms as the equatorial heat heads north. Only running down when we’ve cooled the tropics enough to balance the colder poles.
Eventually the sun will wake up again, and enter a new high activity phase. Probably about 20 years on. Then the whole cycle will reverse. More UV, so deeper ocean warming. Gradually building to a warm ENSO cycle and warmer air temperatures. Lots of added tropical storms until the poles ‘catch up’. Warming stratosphere (so a warming polar vortex) as added UV makes more warming aloft. That cycle will continue until the poles ‘warm up again’. Likely in about 50 years.
Odds and Ends
These are some links and bits of information that I found useful, but didn’t fit into the narrative above. Perhaps due to the flow, or sometimes just due to running out of time. I’ve put then here for reference material.
http://www-das.uwyo.edu/~geerts/cwx/notes/chap01/tropo.html
Has a nice description of the Tropopause. Has a nice picture of how the height changes with latitude too, that we saw above. Tainted only by the use of annual averages instead of showing the dynamic range at the poles. I particularly like this very dynamic picture of the TropoBands nature of the Troposphere:
Tropospheric Bands of Activity
One can clearly see the tropical band where Willis‘ Thunderstorm Thermostat operates. At the other extreme, the polar band where cold air descends from the stratosphere after radiative cooling. In between, the dry descending zone where deserts form after tropical heat was radiated to the stratosphere; and the zone where polar air meets zonal air and makes ‘interesting weather’. ;-) The place where tropospheric water vapor and CO2 get mixed into the stratosphere. We also have the two jet streams seen in static cross section. That’s where the sideways motion happens. When we have a meridional flow (instead of a zonal flow) those jets make more dynamic changes to total mixing area and total length of the descending air mass lines. I think ‘that matters’ to total heat flow…
Stephen Wilde has a model that discusses changes in jet flow here along with some other detail on how ‘things change’.
An interesting quote:
On the other hand, colder regions have a lower tropopause, obviously because convective overturning is limited there, due to the negative radiation balance at the surface. In fact, convection is very rare in polar regions; most of the tropospheric mixing at middle and high latitudes is forced by frontal systems in which uplift is forced rather than spontaneous (convective). This explains the paradox that tropopause temperatures are lowest where the surface temperatures are highest.
This, too, tends to confirm the convection driven tropics and the more placid polar regions dominated by descending air.
http://scienceofdoom.com/2010/04/18/stratospheric-cooling/
Also covers stratospheric cooling.
I have a ‘riff’ on why the lower atmosphere doesn’t radiate effectively that will have to wait. I’ve spent 2 days on this so far and it’s time for dinner… but I’ll do another posting on that topic. It was what started me on the path that lead to this post, and the one from yesterday:
https://chiefio.wordpress.com/2012/12/10/do-temperatures-have-a-mean/
so it’s been a long and complicated couple of days, but worth it, I think. As a ‘clue’: The basic idea is that pressure broadening and fluorescent quenching prevent effective atmospheric radiation in the lower atmosphere. That is why dew forms on metal surfaces in a cold night, but doesn’t just make frozen fog in the air… It involves a bit of quantum physics, but not too much, and some gas dynamics… but just enough that I can’t put it in here in a hour… so gets to wait. Tomorrow, or perhaps after dinner. At this point it is mostly just ‘backing matter’ to the established convecting behaviour of the troposphere.
UPDATE: 12 Dec 2012
In the discussion in comments the topic of heat flow across the tropopause has come up. Again with the bias of ‘static scored radiative model’. I found these three graphs useful for understanding the nature of the tropopause. I picked them up from this article:
http://www.atmosphere.mpg.de/enid/791
The key thing to notice about them is that at about 15,000 meters the temperature hits a minimum (the tropopause) AND the wind speeds hit a maximum ( about 85 knts ) with slower on each ‘side’ of elevation. I just have to think that the conductive and heat flow across a friction layer with 80 knts in the middle and 30 knts just above it will be fairly strong… While the flow will be less vertical and more laminar, it still has a fair enough amount of vertical component to allow for plenty of ‘mixing’ and heat transfer across that band. Though I’m still not seeing much need for it. Mostly you need poleward heat flow, not vertical, moving heat from tropical excess to polar deficit.

Wind speed vs altitude

Temperature vs Altitude

Atmosphere Temperature Pressure profile
Again what we see missing from this kind of chart is the variation from equator to pole. That matters. Yes, this is useful information, for ‘mid latitude’ thinking. But remember to ‘unbias the vision’ and imagine those 80 knt forces headed toward the land surface at the 10,000 foot ( 3,000 M ) average elevation of the Antarctic Plateau … That is where the heat leaves the earth surface and where the fulcrum is set.
In Conclusion
So that’s where AGW has got it wrong. It fails to distinguish between stratospheric as the radiative regime and tropospheric as the convective evaporative regime. It fails to use a ‘dynamic scoring’ that recognizes the changing location of the tropopause based on heat flux as driver. It fails to recognize the hysteresis bound regime based nature of heat flow in a very dynamic, non-radiative troposphere. And, most importantly, it fails to recognize that closing an already closed tropospheric CO2 window does nothing that matters. Water is the active agent below the tropopause, and even here it is not as radiative BLOCK to cooling, but as evaporative transport doing cooling, and as the radiative couple to the lower stratosphere.
More heat doesn’t make a radiative driven runaway greenhouse in the troposphere. It makes a faster running heat pipe moving water vapor to the base of the stratosphere and a faster heat loss from the stratosphere.
In short, they forgot to identify what actually happens before they made their ‘mental model’ and played with it.

Please excuse this bit of what you call “snitidude,” but I think you are (at long last!) on to something real. The (so-called, if you will) top of the troposphere is separated from the (so-called, if you will) bottom of the stratosphere by the (well-defined but hard to measure) altitude at which the lapse rate changes sign: The tropopause. If you understand radiative heat transfer you know that what matters in radiative emission through a densely absorbing medium is the temperature of origin (the ground, more or less) and the temperature of the effective emitting (out to space) altitude. What if that altitude is at the top of the troposphere, at the tropopause? Then increasing absorption in that layer cannot effect emissions if there is no change in the temperature of the top of the layer.
The question is not whether CO2 is a greenhouse gas. It is. Get over it. The question is whether increasing CO2 concentration changes the temperature of the altitude where the lapse rate changes sign.
Good luck in figuring this out!
A”TropoBand” that seesaws with the seasonal heating, from north to south and back, is a good word picture. This is way too complex for climate scientists. They need to simplify and make assumptions to model the actions of the atmosphere. As they say of Olympia beer “Its’ the water.” ;-) pg
@P.G.Sharrow:
Do they still make Olympia Beer? It was my first beer ever and I have fond memories of it ;-)
The wiki says they ended in ’83 or so… Maybe someone can restart them…
“It’s the water, and a lot more…”
;-)
Damn! 1983 you say. Ah well “Oly” never impressed me. Too close to water. :-( pg
So CO2 is 95%, some more released and this increases pressure almost 100% on Mars and then it warms LOLOL Yeah right http://www.nasa.gov/mission_pages/MRO/news/mro20110421.html
Excellent article E.M. I’ll reblog it on the talkshop.
Reblogged this on Tallbloke's Talkshop and commented:
An excellent article by E.M. Smith, the ‘Chiefio’
Thank you. A real classic!
Thanks for the attribution, Chiefio.
I’m about to give tallbloke a piece that gives a new general overview describing how and why adiabatic processes regulate diabatic processes which I think tops and tails it all very nicely.
Yet another very interesting post!
I just hope that cooling effect of CO₂ isn’t stronger than its warming effect. Too cold this morning here at 60 N!
Thanks Chiefio.
Your musings are always a great read.
A Great Read as usual.
One practical question comes up if the convective heat engine is running faster: will storms be more powerful and more frequent? For insurance purposes, should we expect more flooding and wind in certain areas (leaving aside increased development)? Or is the system so complex and variable that we can’t tell?
Very interesting. The peculiar device of ‘top of the atmosphere forcing’ beloved by computer programmers as a tractable way of including conclusions about the impact of atmospheric composition changes into climate models has long been a puzzle to me. The variation in the radiation budget at the ‘top’ of the real atmosphere is a result, an effect, of a spherical spinning planet and fluid dynamics (including a big role for the phase transitions of water). The programmers turn this around, inserting an instantaneous change in this budget as a cause, a driver of, inter alia, temperature changes below it. As I understand it, they install the change and wait and watch (the models do seem to need some pampering to avoid complete nonsense) while their atmospheres re-adjust. This is backwardness of a high order, and it is not at all clear to me that it should work. Especially for CO2 changes, which generally begin at the surface in relatively very high concentrations that vary continuously (not instantaneously) in both time and space, and which take a while (days and weeks) to be dispersed and mixed-in, a period in which their contribution is ignored by the GCM modellers (again, ‘as far as I know’, which I fear is not very far – so criticisms of this note would be very welcome).
It will be much simpler the day we forget the current paradigm about everything and start thinking about charge and discharge. Lightnings fall before raining, ya know buddy. Trouble is that in spite of the fact that ALL our modern gadgets and appliances work on electricity, electricity it is not taught to children in schools. The first country to do it will succeed over the rest.
I’ve referred to the “warming effect” and “cooling effect” of GHGs for many years now. It’s nice to see someone finally putting some thought into this. You’ve cemented my own thoughts very nicely. I do feel that CO2 does add a little to the GHE in the Troposphere. However, that is countered by the cooling effect the higher one goes and a slight increase in the water driven heat engine.
I like to call GHGs the climate control gases as they work like little climate control systems that warm the planet when it starts to cool off and reverses the effect when it starts to warm up. The net result is the temperature range falls into a band that is capable of supporting life. An interesting result.
@Peter O.:
I’ve added an ‘update’ at the bottom of the article with some wind speed vs height graphs that I think matter to how the tropopause is ‘visioned’.
Well, looks like I’ve managed to get your stuff out of the SPAM queue…
If I’ve got you thinking this one-eyed squirrel has found a chestnut then it must be good ;-)
Some minor points: “(well-defined but hard to measure) altitude”
Well, it isn’t well defined, really. It’s dynamic. (That was sort of my point…) So the properties used are variable depending on who’s definition you like (UV, Ozone, water, lapse rate) as different definitions use different ones; the altitude is dynamic (in any latitude AND due to local conditions, proportional to surface heating – so one presumes also changing day-night… a ‘dig here!’…) and even changes based on individual storms. (Look up ‘anvil top’ and ‘overshoot’). It’s hard to measure a location for something that boiling, roiling, rolling, tearing, and being punched through… Rather than fight all that, the key ‘take away’ is the realization that the dynamic nature is an indicator of and results from variations in surface heat. Any surface heating just drives the process faster and further and changes tropopause height and activity. Leaving radiative heat loss to the stratosphere to deal with.
Per your described ‘radiative heat loss’ process: The ground is just not relevant. It isn’t “ground” that radiates to space. “Ground” is cooled by evaporation (since the “ground” is mostly sea…), conduction, and condensation at altitude. Radiation happens in the stratosphere.
The AGW model gets it’s panties in a bunch about radiating heat across the tropopause. As though it is some kind of static barrier. It isn’t. The Stratosphere is stratified by temperature (higher on top) but it is not static. Winds are higher there. Just more laminar. The tropopause isn’t static either. There’s a lot of mass flow across it. (I’m looking for sources of info on just how much, where). We know there’s a lot of mass flow due to anvil top clouds, thunderstorm “overshoot”, folding at the jet streams, descending air masses in the arctic vortex (that had to get up there somewhere), and more… So the ‘radiate across the tropopause’ question is the wrong question to ask.
Yes, I’ve been pondering this for a while, thinking about how to put into words this process. Was thinking an article, but putting some here may help polish the ideas…
See, the upper Stratosphere is hotter than the lower Stratosphere. Not going to get a whole lot of radiation upward from cold lower stratosphere to hotter upper stratosphere (though we are, at least, now in a pressure regime in the stratosphere where radiation can happen as the gas molecules are not losing all their energy to thermal collisions…) So any ‘IR radiation’ is going to be net outbound from the top of the stratosphere, not inbound from the bottom. Similarly, a cold tropopause isn’t going to do a lot of IR Radiating either (see blue graph). The water in the upper troposphere does radiate (likely to be absorbed by stratospheric water above it – the broad blue band – again not CO2 mediated…) but mostly we’re talking ‘cold balance’ at the tropopause and net heat out from the poles during their stratospheric phase… (i.e. winter) and mass transfer mediated (i.e. cold descending polar vortex).
Similarly, the troposphere is just not a radiative regime. It is dominated by the water cycle that is mass flow driven, evaporation, condensation, conduction. It’s warmer on the bottom and cooler on top, so that regime CAN run here. So it does. And it dominates by far.
OK…
On the top we have radiation, largely net in balance, but net outward from the air at night, and with radiation in from the sun 1/2 the time during the day net inward. UV mostly absorbed in the stratosphere and oceans. Visible partly reflected and partly absorbed (clouds and surface). IR mostly radiated from the stratosphere. Surface heat transported to the lower stratosphere by water. No role that matters for IR below the stratosphere.
Add in polar dynamics. In winter, the poles have a long, cold, stratospheric night. LOTS of heat radiated to space. How much? Enough to freeze several feet of ice every winter… That ‘net outward’ at night means 6 months at the poles… That stratospheric radiation happens at near ground level in the polar regions. CO2 will cool the poles, contrary to IPCC expectations.
The equatorial zone is net excess heat in. They cycle and boil with evaporation, precipitation, storms, and winds. Moving that heat up INTO the lower stratosphere (punching through the tropopause in ‘overshoot’ and via anvil top clouds, and conduction and…) that then promptly distributes it around the globe in very short order at several hundred miles an hour…
Between that ‘heat out at the pole’ and ‘net gain at the equator’, we have the ‘mid latitudes’ where interesting weather happens as those two mass flows interact. (Polar air masses headed under the warm air toward the equator. Equatorial air masses trying to descend back from the tropopause. Added surface heat powering the next set of cells. But it’s not a net heat gain / loss game here. We’re the ‘net’ between the two players of the equator and the poles…
In essence, looking “up” for heat transfer is just wrong where we have most of the thermometers. Heat is lost at the poles, gained at the equator, moved in between.
Looking at the tropopause as the radiative window is the wrong place to look. It’s the low point of temperature, not the high point, and it’s the place where the domination of water STARTS to run out, not ends. Look again at that CO2 ‘cats eye’. Strong radiation is HIGH in the stratosphere. radiation across the tropopause is the wrong model. It’s mass flow and conduction. ( Heat doesn’t radiate from a cold tropopause to a hot upper stratosphere and / or hotter thermosphere…)
In fact, I’d go so far as to assert that the tropopause is the equilibrium point of planet temperature. Above that point, UV heating dominated the temperature profile. Below that point, water transport dominates the heat profile and ground heating by incoming, not IR, radiation dominates. (IR path length is too low to let anything happen and any IR absorbed, contrary to the IPCC dogma, is thermalized by collisions due to the high air pressure.) So we get a hot surface (from visible and UV) and a hot upper stratosphere (from UV). and nature trying to balance those two to get the ‘net net’ energy flow. One transporting upward via water the other radiating outward via CO2 and Ozone IR. The balance point being the tropopause. (which crashes into the ground near the poles… I’d even go so far as to speculate that the antarctic is cooling due to more cooling stratospheric influence at those high plateau altitudes and the arctic not so much due to a bit more tropopause warmth from this solar warm cycle just ended).
In short, surface temperatures are set by water physics, not IR, especially in the tropics. Stratospheric temperatures are set by IR gas and UV solar physics balance, but don’t matter to the troposphere, until you get to the poles. Solar UV variation matters more than the IR gas. (See the latest changes on a ‘sleepy sun’…)
So I think your ‘framing’ of the question as ~”What does CO2 do at the tropopause” is ill formed. “Mu!” – if you will. We know what it does. (See the big blue chart above. Nearly nothing is happening in the IR band at the tropopause. It’s mass flow driven and it’s the balance point between two hot ends, radiatively speaking.) The proper question is “What does stratospheric CO2 do to polar descending cold air?” tightly coupled to “What is the relative impact of solar UV changes?”. Solar dominance makes the CO2 interesting, but much less relevant… The stratosphere is NOT static. It’s highly dynamic with LOTS of mass flow. Get out of the ‘static scored radiative straight jacket’!
@Tallbloke & Tim Cullen:
Thanks! I try… though some folks say “I’m trying”… ;-)
@Stephen Wilde:
Your version of that model is much more complete than mine, and likely more accurate. Besides “many hands make light work” so it’s easier to just say “See his stuff for the jet stream dynamics part” ;-)
Just the way a ‘community barn raising’ works… “Hey, you take the top beam and I’ll do the rafters.”…
When the tallbloke bit goes up, give a holler and I’ll link to it.
@Espen:
Interesting point… At 60 N you get the polar regime flow part of the year. More CO2 might well make descending polar masses more cold during low UV solar regimes. Still, I think solar UV is far more important to your warmth…
@Handjive & A.C. Osborn:
I just think things through for a while, then try to ‘tidy it up’ a bit. The words are just the result of ‘keeping a tidy mind’… but glad you like it!
@Gary:
IMHO the ‘heat engine’ part need to be divorced from the “stronger weather” part; AND needs to be defined ‘by tropoBand’.
So for the overall “heat engine”: What makes it “run faster”? Only one thing. More solar radiation in. (More heat out via CO2 at the stratosphere will run faster for a little bit, but only until the earth gets colder to balance. Days? Months at most?) We’ve just had a great example of this change. The sun WAS getting slowly warmer, and we had “global warming” from the ’80s to 2000. Prior to that the sun was getting cooler and we had “The New Ice Age Scare” of the ’60s-’70s (that I remember so well… snowed in my home town twice. Only folks in their 70s, or so, then, remembered it snowing before… and it hasn’t snowed since.) Right now, the sun has ‘gone way sleepy’ and we’re getting LOTS of cold and snow showing up.
So it’s pretty clear that the ‘heat engine’ changes pace far more in sync with the solar wobble than anything else. (There’s also those deep time historical periods of way high CO2 and both warm and frozen regimes… so it’s not CO2 that matters…)
“Stronger weather” is more complex. It depends on the strength of the differential between polar cold and equatorial warmth. The equatorial warm level has a lid on it via the water cycle (Willis and the Thunderstorm Thermostat) but that Polar Cold varies with the Stratosphere. That wasn’t a problem, IMHO, when CO2 was providing a cooling push to the Stratosphere but more UV during a hot solar cycle was providing more heat to dump from the stratosphere.
But now? Now we’ve got a solar funk and “way low” UV levels. Heck, I haven’t used sunscreen in about 6 years now and I can’t do an hour in the garden without it (in prior times). Things have changed. (Admittedly, my habit is to avoid UV times of day… but typically I ‘make a mistake’ every so often. Haven’t had a sunburn from those mistakes in years now…) So we have much less UV heating of the stratosphere AND more CO2 driven cooling. I think that pretty much means that the polar winter cold blobs are going to be colder. It does leave open the question of ‘how much colder’. Still, a colder ‘cold pole’ and the same temperatures in the tropics ought to result in somewhat stronger storms in the middle.
In short, it will depend on where you are. Polar? A bit colder and more snow / ice. Watch for glaciers to start growing again. (As cooling stabilizes, and the oceans get colder, the snow drops back to more normal). Equatorial? Perhaps a bit milder (as the UV deep ocean heating is less) but since they are already ‘water limited’ this will not show up as temperatures. Only as weaker hurricanes. (That we’ve already seen with lower ACE and no major landfalls in the USA in several years.) In between those two? See Stephen Wilde’s paper.
Also look up the works of Marcel Leroux for how ‘polar blobs’ move:
We get the “loopy jet stream” as the polar colder tries to get to the equator more. Alternating warm blobs headed north (think east of the Rockies this year and warm) and cold blobs headed south (think UK this last winter and now). It will depend on where you are relative to the ‘blob’ formation process… For me, in California, we’ll likely get more rain for a while, then a bit of drought. For the UK and Western Europe, mostly cold. For Egypt / Mesopotamia IIRC they get drought. Russia ought to get a ‘bit of cold’ and China typically gets a mix of drought and very cold. Equatorial regime is more important in the S.Hemisphere, so it only gets ‘interesting’ in Chile / Argentina and Australia. Unfortunately I’ve not done enough looking at their history (that isn’t as well recorded for the Dark Ages / Medieval Warm Period) so I don’t have as good a ‘mental model’ for them. If you look at the Dalton Minimum it ought to be a decent guide for what happens in your area. Figure on a 10 to 20 year onset time period.
Short Form: I’d not expect a lot of ‘worse storms’. But I would expect quieter tropics, colder polar regions, and a more interesting / historic pattern temperate zone – mostly driven by the solar changes, not the CO2.
@John Shade:
It’s easy to get causality running backwards in computer models… But IMHO a large part of the “problem” is that the folks doing the ‘climate science’ are not professional programmers and have not spent ‘time in the trenches’ dealing with an endless flow of bugs… Contract programmers brought in will not be atmospheric physics wizards, so won’t question the direction of causality. Just collect the problem description and write the code.
That’s part of why I’m so “hung up” on looking at “what really happens”… I’ve spent a lot of time on contract as a ‘consultant’ figuring out where people were “computerizing the wrong thing” and “had it backwards” or “just wrong”… I learned a long time ago to “Accept the client problem description, but ‘think it through’ and ask if something looks wrong.”… (yet ‘reality constraints’ required also to “leave it alone when they growl that the problem description and solution design are finished topics”… )
IMHO, the variation in CO2 throughout the troposphere is just not relevant. It’s a water dominated regime and CO2 is just along for the ride. At the “Top of the troposphere” we have a mass flow regime and a temperature low point, so radiation doesn’t matter either. In the Stratosphere we have hundreds of mile per hour winds and laminated / stratified temperatures. Radiation dominated, but CO2 is very well mixed. UV is more important than IR.
But yes, the ‘visioning’ of things as spinning, wobbling, rising and falling, having thunderheads ‘punch through’ and winds whipping around the planet… that’s what’s missing from the “modelers toy world”.. and ‘it matters’…
A very informative post and lots of thought generators. My first thought upon reading was this:
Sunday evening at about 11 PM some part of one of the Tropobands slammed into the side of the house at 44 mph and rattled the windows. A friend, living nearby with a house more exposed than ours, wrote that they were up because her young daughter was scared by the noise and the shaking. Movement was downslope on the east side of the Cascades and a Snow Eater. The atmosphere is amazing, better than movies, and watching is free.
Next came these thoughts:
That first diagram is a good one but I would add two ideas. First, being a static cross section, it does not show the vigorous character (dynamism) of the atmosphere. Second, there is no way of showing the Coriolis effect in this diagram. So, “flag” these and use as needed for clarification.
Maybe a third thing too: Mountain ranges extend high enough to squeeze “rivers of air” against the upper layers.
I don’t have the numbers but I think the cold polar air is lower in absolute humidity than the subtropical continental deserts. The latter have low relative humidity and a drying character. I have a packed-away text with these numbers but haven’t found them on the web.
“The tropopause crashes into the ground” Since when is 7-9 km altitude “the ground?”
[Reply: 7-9 km is the annual average. In the dead of winter it becomes ‘indistinct’. I.e. near or at ground level. Especially in the 3000 m high Antarctic plateau where some folks are putting instruments instead of on satellites since they get the same kind of ‘stratospheric’ exposure… -E.M.Smith.]
Did you trigger Willis E’s WUWT post? Or has this idea found its time?
I live where the stratosphere has hit the ground of late, its been below -30 C for the last 2 weeks and nothing is moving, no wind, no high clouds and very little moisture left in the air.
When I first heard of global warming, some years ago, my first question was, Yes but whats the down side? Warmer nights and winters, bring it on for Canada.
Now that we see the true scheme emerging I keep coming back to the stupidity of the criminal mind,had a childhood friend who spent endless energy and creative talent on crooked little get rich schemes. If he still lives he’s most likely a welfare case still.
25% of that energy into something constructive and he would have been a millionaire.
This world wide alarm over our way of life, has all the same earmarks, the crim always thinks they are smarter than everyone else, that we will forget their betrayals and lies(cause they forget?) and the jackpot will be theirs.The most insulting aspect of this, is the smug assurance that its for our own good, that we are being lied to.
That the end justifies the means. Usually the same A-holes who lecture us on ethics and sustainable living. My solution a tax on do-gooders of 105% of their gross.
People that think they must control how I live my life and spend my money are Mentally Incompetent and belong in an institution for the criminally insane. They certainly should not be allowed into government. A tax on do gooders won’t work as they will just create a loop hole to escape it. I would just want them to do good works with their own money instead of with mine. I am quite able to select good works to do with my time and money without their help. pg
If you think if the troposphere as convective and the stratosphere is radiative, then you can think about the troposphere like a balloon. When it warms it expands (tropopause moves to higher altitude). When it expands, the surface area from which it radiates now increases resulting in an increase in surface area of the radiator. There is a direct negative feedback to tropospheric warming. If you try to increase the overall amount of energy in the troposphere, it simply expands and the temperature at the surface will remain little changed. I think.
Pingback: Snow, Polar Night Jets, and Cold | Musings from the Chiefio
@John Robertson:
Don’t know. I’ve made it a habit of asking Willis “What is the definition of forcing?” every time he uses it in an article, so maybe I finally goaded him into actually looking it up… and finding out it wasn’t quite as advertized… Or maybe he read about the Tropopause and realized he need a more accurate height and looked at the IPCC doc and found out it was ‘non-physical’…
If I was the cause, I’m happy. If not, I’m still happy. One more set of eyes opened to the crazy non-meaning word “forcing”…
For anyone wondering what we’re talking about:
@P.G. Sharrow:
It’s just a reflection of one of the major Sins. Likely greed and vanity in even mix… and seasoned with Hubris…
@Crosspatch:
Good point. We’re only talking about a 3/1200 or so change…
E.M., here’s a post I just put up on WUWT. Seriously, the three of you might have something to offer the “official” climate science community and although I know each of you do what you do for the pure pleasure of it, your ideas integrated into a coherent whole might benefit mankind if your ideas got some that official recognition (peer review and all that).
“I wonder what would happen if Willis, E.M. Smith, and Stephen Wilde were to put their ideas, data, and analytical approaches together and present a new formulation for climate processes including the likely impact of CO2 and water vapor. I imagine them getting it vetted by thoughtful professional climate heavy-weights and it getting published in Nature. Nah, never happen. The world’s poorer for it…..”
hello,
first of all, thanks for the post. Many things that were yet a little vague in my mind set down more clearly.
I have two questions, if you don’t mind answering.
– if we have a very high mountain (John F. Hultquist said something about it but it was not so clear to me) does the tropopause goes up or stays at the same height?
– If you consider radiation in vacuum only the source and receiver temperature must be considered. If you have radiation through a gas I don’t know exactly what happens. Which is the thickness (and density) of gas necessary for a complete absorption of the radiated energy? I ask this because when you speak of the top of the stratosphere as the place from where heat is radiated into space you don’t consider anymore the surface; thus you suppose that all the heat radiated from the surface is absorbed by water in the atmosphere. But I have the impression that this is not exactly true, and that some heat can be radiated (if there is not too much water in the atmosphere) directly into space from the surface. Where is the discriminating point between a “completely absorbed” case (clouds?) and a “completely radiated” one (no humidity?)?
Thanks!
Kjai
@JP Miller; I believe Smith and Wilde could work well together and would be able to create a awesome paper. Willis, I am not sure of, as he has too high an opinion of himself to work well with others. Maybe as a critic, not as a contributor. pg
Well, I’ve been trashed by Willis for being a ‘pressure head’ despite my support for his Thermostat Hypothesis.
Mind you, I did tell him he ought to extend the principle globally rather than insisting on the tropics being the key location but I don’t think that went down well.
Just wait for my upcoming post at tallbloke’s which I think will produce a step forward.
KE + PE = constant.
So what sets the constant ?
Stay tuned.
P.G Sparrow; the control freaks are afraid. Of everything.
I suggest we trade them to North Korea, for any North Koreans who want out.
Here we see a country living the life the CAGW pushers recommend.
I say let them live their dream.
As for collaboration between Willis, E.M & Stephen, its happening here and at WUWT.
Buy popcorn.
As a refrigeration engineer, I feel that the triple point of water under the pressure of oxygen sets the thermostat for earth. Much as the pressure of hydrogen, in a Servel absorption refrigeration system, sets the evaporation, condensation and absorption of ammonia in water, while at the same time controls the evaporation, condensation and location of the water in the system. Physics, chemistry and gravity utilized to make cold from heat. Magic! pg
I have a question. How can CO2 have a warming effect in the troposphere and a cooling effect in the stratosphere? Manabe and Wetherald’s 1975 paper (http://journals.ametsoc.org/doi/pdf/10.1175/1520-0469%281975%29032%3C0003%3ATEODTC%3E2.0.CO%3B2) “explains” the stratospheric cooling effect thusly:
“As pointed out above, large cooling occurs in the model stratosphere. This is caused by the increase in the emission from the stratosphere to space resulting from the increase in the concentration of CO2• Since the total amount of CO2 above a given level decreases with increasing altitude, the absorption of the emission from above also decreases correspondingly. This is one reason why the magnitude of the cooling increases with increasing height in the model stratosphere.”
p. 7. (Emphasis added). If the bolded statement is true in the stratosphere, then why isn’t it also true at every level of the atmosphere, with the same effect at every level of the atmosphere?
Interestingly, this is also the first paper reporting a model prediction of the upper tropospheric hot spot, a feature of all IPCC models. In the AGW radiative forcing paradigm, the hot spot is required to exist, which is why all the models based on radiative forcing predict it and the modelers keep wanting the data to be wrong. But in nature it does not exist. The radiative forcing paradigm has no explanation for the absence of the hot spot. Even the Second Order AR5 draft confesses both the lack of a hot spot and the lack of any explanation. See Section 9.4.1.3.2. Perhaps the radiative forcing paradigm is also wrong about the radiative properties of CO2 having opposite effects in the stratosphere and troposphere even though the conditions that cause it in the stratosphere are the same in principle as those of the troposphere – that the total amount decreases with increasing altitude.
John Robertson says:
13 December 2012 at 6:48 pm
P.G Sparrow; the control freaks are afraid. Of everything.
I suggest we trade them to North Korea, for any North Koreans who want out.
Can’t be a coincidence. The American readers of Time Magazine just elected the new leader of North Korea as “Person of the Year”. Must be the same crowd responsible of the re-election of Obama.
They probably prefer fat totalitarians with a fetisch for missiles instead of that skinny guy with a fetish for drones.
http://www.google.co.uk/search?q=time+magazine+readers+choice+person+of+the+year&hl=en&gbv=2&prmd=ivnsu&source=univ&tbm=nws&tbo=u&sa=X&ei=a5XLUJafBaaB4gTw44CoCg&ved=0CBkQqAI
If the Chielio will allow me to answer Quinn the Eskimo’s question directly: At sea level, the ground (or the sea) absorbs sunlight, gets warm, and radiates energy in the infrared. This radiation is absorbed by CO2 and H2O, which radiates much of what is absorbed back to its source, the so-called (and entirely well-understood) back radiation, thus retarding energy release and causing the surface to be warmer than if the radiation were not retarded. In the stratosphere, the situation is quite different: UV radiation from the sun is absorbed by O2, but because O2 has no dipole moment it cannot reradiate in the infrared. However, if O2 collides with CO2, it can transfer its energy to the latter, which can efficiently re-radiate (because it has a dipole moment and because it radiates (and absorbs) efficiently in the infrared. Hence, CO2 cools in the stratosphere and warms at the surface.
But I’m sure the Chiefio has a different explanation, which, I will say in advance, is surely…[self-censored].
[ Reply: Well, at least you are starting to self censor some of the worst of it. Now if you can just dial back the sniditude a notch… FWIW, I’m happy to have a warmer present the warmer position. Saves me having to do it as preamble to my opinion. As to my ‘explantion’ – I don’t have one. Since the Tropospheric “Hot Spot” hasn’t happened, I just point at the observed reality and say “didn’t happen so doesn’t happen.” No hand waving needed. Though I’m sure I could make up something plausible to explain what it ought to have happened… just like you did. -E.M.Smith]
So if a molecule of CO2 radiates much of what it absorbs back to its source, does that mean CO2 doesn’t rise when warmed like N2 and O2 do? After all, if CO2 back-radiates, it no longer has the energy to rise does it.
Furthermore, CO2 supposedly warms N2 O2 molecules via collision. There is 1 CO2 molecule to 2500 other molecules in the atmosphere, AND it rises when warmed AND radiates as much out to space as it re-radiates back to ground.
That’s one mighty hard working molecule. A super extraordinary molecule if you will. Do you have super extraordinary evidence to back these claims?
p.s. The surface supposedly only reaches -18DegC without the aid of GHGs. That’s below the temperature of your deep freezer. GHGs absorb the “heat” from this deep freeze, re-radiate this “heat” back to the deep freeze and raise it’s temperature to a nice balmy 15DegC. What’s so hard to accept? lol
Article about the way adiabatic processes regulate diabatic processes via a KE / PE exchange now up at tallblokes and hopfully also soon up at climaterealists.com
typoz etc.:
“lifts up up high” “lost at the polls”
About extreme weather &/vs. warming:
Could it be that a very warm climate is more stable, with fewer contrasts and conflicts between warm-wet and cold-dry? In the process (and even more advanced states) of shifting to cold dominance, the ‘events’ are more violent. As opposed to the peace that prevails when the cold remains huddled close to the poles.
Yeah, I can’t stand the heat of my breath at sea level when the back radiation of the Co2 hits my face.
Peter Offenhartz –
You have proposed a different mechanism than Manabe and Wetherald. They said nothing about collisional excitation of CO2. To the contrary, the statement was that “Since the total amount of CO2 above a given level decreases with increasing altitude, the absorption of the emission from above also decreases correspondingly.” And my point is if this condition is operative and causes cooling in the stratosphere, then the exact same condition at other altitudes should have the same result for the same reason.
Secondly, the statement that Oxygen does not radiate in the infrared is incorrect. It does not absorb IR, but when heated its emission spectra clearly includes infrared. http://astro.u-strasbg.fr/~koppen/discharge/
@Baa Humbug
Molecules with a dipole moment, like CO2 and H2O, are good absorbers (and emitters) of infrared, more than million-fold better than molecules like O2 and N2, which have no dipole. Just because CO2 is relatively scarce is entirely irrelevant. Also, CO2 is “well-mixed” in the atmosphere, so warming a molecule of CO2 dos not cause it to change altitude. Yes indeed, CO2 is a hard-working molecule, and for reasons that are entirely well understood by people who have studied spectroscopy and radiative heat transfer. Seriously, these are matters about which there is zero disagreement among those who have studied spectroscopy. Zero.I cannot understand why anyone disagrees; they merely display their ignorance of the basic science.
@Quinn the Eskimo
You say “Secondly, the statement that Oxygen does not radiate in the infrared is incorrect. ” No, it isn’t. It is a fundamental tenant of radiative heat transfer that a good absorber is a good emitter (at a given wavelength), and vice versa. And, at a given wavelength, a poor absorber is a poor emitter (and vice versa). Really.
As for “the total amount of CO2 above a given level decreases with increasing altitude, the absorption of the emission from above also decreases correspondingly,” that’s true because the density of ALL gases decreases with increasing altitude, not because the RELATIVE concentration of CO2 decreases. The basic idea is that at high altitudes infrared back radiation becomes unimportant because CO2 is no longer optically thick because its density is so low.
@J.P.Miller:
I’d be happy to work with others ( and I do “play well with others”). In some ways, that’s what we’re already doing (in a ‘barn raising’ kind of way). But once I saw that the Peer Review process was corrupt, my interest in being published in a peer review journal dropped and the value in “Just doing it” went way high. So I’d only ‘go there’ if it does not stop other activities.
(My answer to the Pee-er Review was to just ‘plough the field’ and give permission for others to work anything I turned up into a peer paper… for a footnote ;-) I ‘have ego problems’… in that mine is too small. I just don’t get wound up on the whole ego trip thing….)
For now, the “highest and best use” is just to figure out what REALLY is happening and show where the AR folks have things clearly broken. In public. Once that’s done, I’ll be more interested in things that take a decade to get published and involve a year (or two) of sequestration of your ideas “in review”…
But hey, one of them wants to flog the system with me as co-author, I’d be glad to contribute.
@Kjai:
It depends on where the mountain is, and how high. And how hot.
So the tropopause goes lowest in the polar zones in winter. Down to where it becomes “indistinct”. Now put that air in motion. If it whacks into a mountain, it will tend to deflect and put a ‘ridge’ in the air. As part of that process, we get ‘blobs’ of ‘arctic air’ sliding down the backside of the Rockies in winter. That will put the tropopause higher on the California side (more warmth and a generally west to east air flow putting ‘ridge lift’ over the mountains) and lower on the ‘backside’ where the arctic air blob is heading south ( less heat, air descending off the ridge lift).
Does it matter? Probably not. It is unlikely to be very big, especially as you get further from the pole and closer to summer. By the time it’s Summer at the Equator, you are talking a 20 km kind of altitude. U2 Flight Level. Any impact of anything short of K2 or Mt. Whitney will be hard to find.
Oh, and there’s that whole Hadley Cell, Ferrel Cell, Arctic Cell step down process. To the extent you have a mountain range that runs east / west at the point where those cells have a boundary, they could slow the propagation and / or put in a step function where the air shifts to the other side of the ridge. (Think Himalayas and Alps…) So you might get some local weather impacts during the transition months.
Most of these things will be indirect, due to shifting grown warming patterns, not just ‘ridge lift’ over the hills The major modes (things like tropical band lift) will remain intact. You can likely see the effects on the global vapor maps of the world. Slight distortions where the band of vapor gets skinny, wide, or has a break, right at or near a mountain range. So hit that link in the posting and see what you can see ;-)
(To me it looks like a little deflection of the air flow with some downwind changes in cloud cover and water vapor. That will cause ground temperature variations that will cause minor tropopause variations. In the equator, the number and size of thunderstorms will change a bit, so you get fewer ‘overshoots’ and high altitude ‘lifting’ of the tropopause in some places. )
In short, I think the mountains will effect the weather most, that then has a minor effect on the tropopause. So let the local weather be your guide.
The question of radiative length is a very complicated one. It starts with some quantum mechanics things. The more pressure on a gas, the more it has collisions and the less it has radiation events. (I’ve been working on a posting about this for about 4 days now… it’s complicated…) So “down low” the radiation from a surface whacks into an atom pretty quick. (The path length is short to absorption). The atom it hits is highly likely to turn that into heat by whacking into another atom of some other gas. Quenching the further radiation.
At altitude, it’s a longer mean path to hit an atom, and then it is much more likely to re-radiate as there isn’t much chance it will whack into another atom prior to the time to radiate. ONE of the definitions of ‘TOA’ is ‘point were radiation can happen well and thermalizing not so much’.
(There’s also something called ‘pressure broadening’ and more that change the absorption bands down low…)
In short: At the ground there will be SOME radiation, but it doesn’t get far in the CO2 band. It does better in other bands. Up high there will be much more radiation (but a lot less mass to do it…) Above the stratosphere, it is pretty much only radiation that matters. So an object at the surface CAN cool radiatively, and some of those photons can even go all the way to space in one shot. Just the odds are that almost all will be absorbed somewhere in the middle and have to ‘try again’…
Where is it “complete”? Depends on a lot of things. What frequency? For CO2 bands, it’s about everywhere and ‘not far’. (So things have to ‘daisy chain’ atom to atom up the air column). For non-CO2 bands, like water bands, it is easy to get much more open path to space. Go sit in the desert on a cold winter night with near zero water vapor…
So, in the posting, I’m much more “absolutist” about radiation transfer when the reality is far more messy. The “absolutes” are a simplification of the reality for easier (i.e. shorter) understanding.
One key point, though: In most cases I’ve specifically been talking about the CO2 radiation, not the TOTAL radiation. Simply because it’s CO2 that is The Accused. So in that desert, the reason you feel cold from radiation is the drop of water vapor, not anything to do with CO2.
Second point: It is the assertion that the tropopause forms some kind of radiative break. That only radiation matters in heat flow across it, via CO2, which is wrong. It is a fast moving thin layer of air between two different regimes, so a load of ‘mixing’ can happen and a lot of conductive based heat flow. It’s not just radiation.
@P.G.:
At one time I was tested (full psych profile and all) in a process that was to select those most able to work well with others. (The end result is a psych profile used to select our astronauts to date. Yes, they are modeled in part on me…) When you are putting folks in a tin can for a year and they can’t get out, well, they need to work with all kinds and under all conditions.
So, in short, I can work with anyone. ( Though they can’t always work with me… can’t fix everyone…)
So while Willis and I might ‘have words’ at times (like my needling him over using ‘forcing’) we still ‘get along’.
@Stephen Wilde:
Waiting for what sets the constant… and we’re waiting … and we’re waiting…
Oh, look! It’s a link! ;-)
@P.G.Sharrow:
Interesting idea… treat the system as a heat driven refrigerator… hmmm…
@Quinn The Eskimo:
One problem with the quote is that it doesn’t make clear if things are decreasing with altitude in percent concentration or absolute amount. We know it does in absolute amount as the pressure drops…
As for the rest of it: You can spend your life trying to explain how a broken idea “works” and never get anywhere. That is why I strongly try to avoid “angels and pins” arguments.
So what we know is that convection dominates below the tropopause. All the radiative hand waving is amusing, but not relevant. In the stratosphere the radiation is dominant as the air is stratified and very very thin. You can see the radiation dropping as the CO2 ‘cats eye’ gets thinner toward the bottom. At the tropopause not much is happening (on that blue graph).
At any rate, the big difference other than convection and the water cycle below is pressure. That increases the tendency to quench any radiation that’s in any absorption band. So there will be differences ‘below’ vs ‘above’ the tropopause. That’s where the AGW folks like to play. Explaining all the radiative differences. It’s just that ignoring all the mass flow and convection and entropy change are an error…
@R.de Haan & John Robertson:
The “control freaks” are ‘having issues’ and it’s going to get worse. A lot worse. That won’t stop them from pushing through to a Jump The Shark moment, though.
Time Magazine is run by loons. Haven’t bothered to read it in decades.
@Baa Humbug:
Looks to me like you’ve got it…
In my view of things, near the ground any radiation that CO2 absorbs is rapidly thermalized into N2 and O2 and H2O. You can’t get much radiation that matters with all that water around until ABOVE the tropopause.
The whole “back radiation” thing depends on lack of absorption and lack of thermalizing. Oh, and lack of mass transfer across that tropopause “boundary”. You know, the one with 80 knt winds whipping past at at least 2 x the layers on each side (perhaps 1.5 x as we don’t know the relative directions of those winds) yet not having any turbulence, mass flow, or conductive heat flow?
It’s just crazy, really. Think about it. An, net, 40 to 120 knt sideways wind flow (going where?) that has no turbulent mixing at the sides? That runs 6,000 miles to the Polar Vortex, taking big jumps over the discontinuities between cells / troposphere bands, all the time having only radiative heat transfer? Just so wrong.
@Brian H.:
Thanks, I’ll get to them…
Yes, hot is more stable and less chaotic, less swings of weather regimes. As the atmosphere gets higher their is more room for things to get spread out and less squeezed. As the air gets squashed down, the activity gets more compressed. The jet stream goes ‘loopy’ and activity picks up.
More after coffee…
@Peter O:
The “issue” isn’t about “Is CO2 a ‘greenhouse gas'”, so I don’t need to ‘get over it’.
There are 2 issues. Each distinct.
1) The “greenhouse gas” word is a flat out lie.
One of the things that I’ve found most useful over the years in ‘keeping a tidy mind’ is any time someone “makes up a word or phrase”, never accept it unconditionally. In the case of “greenhouse gas”, I use the word, but always realizing it is flat out wrong. A greenhouse works from preventing convection. A “greenhouse gas” can not do that. So immediately, you know that it’s a broken concept.
Using a broken concept (convection is prevented) in a regime where it isn’t valid is an error on the face of it.
The proper question / framing is to say “CO2 is an infrared Radiative Gas.” IRG if you want a short form. Now, with that in mind, the “issues” of more of it can be correctly addressed. The “thought frame” of “greenhouse” is out of the way and convection can be recognized as important.
2) When and WHERE is CO2 an IRG? ( or GHG for those with broken metaphor filters).
It just isn’t in the troposphere. ( FWIW, I have an IPCC statement to that effect ‘in the locker’…)
It clear IS in the stratosphere. ( See the ‘cats eye’ above.)
The whole ‘back radiation’ issue focuses in on the Tropopause. Yet that is visioned at a static barrier. It isn’t. (Another broken idea that is embraced in the Warmer view of things). We have massive air down flow in the polar vortex. It came from somewhere… We’ve got 80 knt winds going sideways ( that tropoPAUSE isn’t very paused… it’s ‘booking it’ for the poles pronto). A (relatively) thin layer of air doing 40 to 120 knts relative to another layer of air IS going to have some boundary turbulence and conductive heat flow. How much? Nobody is measuring it. It is ignored. There will also be mass flow and even some enthalpy things going on… That water vapor that IS in the stratosphere didn’t get created there. But the “warmer” POV is that only the radiative heat transfer happens there. That’s just wrong.
So at the tropopause, there is some radiative transfer (but I’d assert, not much. Look again at that blue diagram. Biggest window I see is for that red water spot below the tropopause to be radiating into that water band (dull blue) above it. CO2? You can see it’s quenched already as the “cats eye” tapers out toward the bottom. So yes, it IS a strong IRG, just one that gets rolling about 1/3 of the way up the stratosphere…
(And ignoring water as an IRG is a big mistake…)
@Sabretoothed:
I think Mars is an interesting case. Loads of CO2, yet can’t get itself warmed. Even has some water vapor. It would be interesting to put it (in terms of pressure) on that Blue chart above and see if the CO2 is in a radiative pressure regime…
I suspect that landing enough water rich comets on Mars could turn it into a ‘2nd Earth’. Would take a heck of a lot of them, and you would need to find a way to prevent all the ice from just going to the poles and staying there (i.e. not enough subsurface warmth / subduction / nuclear heating… so need some other process.) and it will leave on the solar wind relatively fast, so likely need to ‘fix it’ every million years or two ;-)
@Tallbloke:
Thanks! I keep meaning to spend more time at your place… then the spouse finds things I “need to do” … sigh. I really need a 30 hour day…
@Adolfo:
See the newer article about the magnetic changes and Heinrich Events. I think there’s an Electric Universe angle to explore in the changes of ocean currents and magma movements.
@John F. Hultquist:
I hate it when I get slapped around by a TropoBand! ;-)
Leroux covered the polar mass interaction with mountains thing rather well. Once I get a chance, I’m going to find his papers (again) and put some of it up here.
He has it right.
But yeah, trying to put a 4-D (time is the 4th) animated chaotic thing into a 2-D diagram is, er, “not quite right”… That’s why, IMHO, the static radiative troposphere model is so wrong, yet so accepted. The picture is widespread, but dead wrong.
So look at that ‘temperature vs altitude’ graph. The AGW theory depends on the coldest layer of the tropopause “back radiating” to the hottest layer, the ground. Just not going to happen. Aside from the fact that the “path” is already closed in the CO2 band, there’s the problem of “cold to hot” heat transfer. That is usually dodged with an insulation metaphor. Yet what insulation do you know of that is an evaporative convective heat pipe?
Which ends up putting the whole burden on the tropopause layer (as we can SEE that the Stratosphere is strongly radiative AND cooling…)
Now, if IT were doing the radiating, it would also need to be doing some absorbing. Either it is radiating that heat back down to the troposphere to keep it in (and so would show as one of the radiating spots in the Blue Chart – which it doesn’t…) or it can absorb excess radiating (and would be warmed by those Stratospheric emmission from a slightly warmer stratosphere. – which it isn’t. The only reasonable conclusion is that the tropoPause is a heat CONDUCTING band. Not doing a lot of absorbing nor radiating.
And with that, I think I’ve looked at every comment and caught up. (some, maybe twice ;-)
@Chiefio: You say “And with that, I think I’ve looked at every comment and caught up. (some, maybe twice ;-)” But two of my comments are still awaiting moderation, one a response to Baa Humbug and one a response to Quinn the Eskimo. I’d like the opportunity to respond to their critiques and questions.
[Reply: I was talking about my ‘catching up’ on reading the comments on that article. Not servicing various queues. Re-read the “about” box where it says “there is only one of me”. Between that ‘catch up with READING’ and now, I’ve had to cook dinner, punch-down shape and pan tomorrows bread, cool and wrap the corn bread, and deal with some laundry. I’m the “house husband” too… So sorry that I couldn’t serve your needs prior to those of my family… -E.M.Smith ]>/b>
@Chiefio
Thank you for posting my response to Baa Humbug. I look forward, when you have time, to posting my response to Quinn the Eskimo. I am well aware that you are a busy person; so am I, but I am a much slower person than you are. I am trying to teach you and your readers some of the basics of radiative heat transfer, a subject I have studied in considerable detail. I have learned to keep my comments within the bounds of your rules. I think it would be easier for both of us if you would take me out of “moderation hell.”
For the record, I am not a “warmista.” I am a skeptic. But when it comes to something I know about, i try to insist that the facts, the science, is correctly presented. Thus, my fury at those who misunderstand back radiation, which is a relatively simple matter when radiative heat transfer is under discussion. There are things that are under dispute, and then there are things that were settled 50 or (nearly) 100 years ago. When people try to argue against (quantum) theory that was settled more than half a century ago, I get very upset. I will try to contain my anger in the future, but ignorance is ignorance, and debating with people who have no knowledge of the Swarzschild Equation is hard work. What I find odd is that no one Googles this equation; no one finds fault with it. It isn’t hard to understand the equation itself, not if you know quantum mechanics. Even a little quantum mechanics. And, if you want to understand radiative heat transfer, you’d better have at least a basic understanding of the implications of this equation.
Thank you for your patience with me.
[Reply: Boy, fast on the trigger finger. I clicked “approve” on both of them as fast as I could read them. (Once I’m servicing a queue, I tend to do all of it.) Maybe all of 30 seconds between them… BTW, folks earn their way into, and out of, the moderation queue. I run one of the LEAST restrictive moderation processes you can find. BUT, because there is only me, and some folks prove they can’t “play nice”, the only way to prevent “food fights” and the place turning into a swamp of dreck is to hold to the “rules”. THE strongest one is “play nice”. Unfortunately, “nice” seems to be very hard for many folks. (Even I have my not-so-nice moments…) So how to get out of the moderation queue? Time. It takes a lot of time to get in, then time to get out. So folks with a lot of ‘attitude issues’ or who do ‘repeat offending’ get a ‘toe dip’ then a ‘toss in the pool’. At that point it’s a long haul to prove they can ‘play nice’ on a consistent basis. And, frankly, the repeated complaining doesn’t help your case. (It tickles my ‘annoying’ flag, and that tends to reset the ‘time to wait’ timer. It’s generally run by my subconscious as I’ve delegated, so it’s not easy to ‘undo’ that delegation.) Per the “Quantum theory settled 100 years ago”, well… We just had a new 2 Slit test that had the surprise result that not only does the parti-wave go through both slits, then reduce to one slit after you observe it, but we’ve been able to make the decision to observe AFTER the passage through the slit(s). That means it communicates backwards in time to change what it’s going to do… Turns out it wasn’t so settled after all…
Does that mean I toss out all QM? Or that the failure of it and General Relativity to ‘play well together’ means I toss out both or either of them? Nope. But it DOES mean that I’m willing to think we might not be able to fully trust it. That there very well might be something we don’t know yet. That it might be applied wrong. That maybe Newton’s Laws of Mechanics were not quite right either. ALL of them can be useful, but we really do need to accept that some of it could be ‘an issue’. “Trust, but verify”. Even if you’ve used it a 1000 times just fine.
Style conflict: Now that may well mean that you, and I, have a style conflict. You want to have “appeal to authority” and “settled science”. I have “Authority is nice but I want to see it for myself” and “Science is NEVER settled, but it can be useful.” When you react to that with impatience that bleeds into “attitude”, you go to The Queue. Sorry, but I can’t take “attitude” in my own house at my own party. So you work on ‘anger management’ and I’ll have no reason to deal with The Queue. (Believe me, I have NO desire to do queue management…)
So you want to ‘play teacher’ on radiation issues. Fine. Just don’t play “Authoritarian teacher” nor denigrate someone who wants to ask an interesting question that you find “ignorant”.
Per being a “skeptic” not a “warmista”: Well, a lot of what you have said sure leaned ‘their way’. But one of my basic beliefs is that others can not define you, only you can define you (but by your actions). Walks like a duck and all that… But tell you what, why don’t you try putting in some sentences about things you think OUGHT to be addressed, while saying “This path isn’t fruitful”. For example: “Backradiation conforms with the Swarzschild equation, so you need to find fault with that to succeed with this argument. It would be better to look at how water vapor at altitude causes more heat flow out, as that’s the real issue.” Oh, and please, don’t attack folks for “asking stupid questions”. I LIKE asking “outside the box” questions. Usually (80%?) end up just confirming the orthodoxy. But along the way you learn interesting things… I think you may well find many of the things where you ‘got excited’ were phrased as questions, rather than assertions of fact counter to reality… So ok, you want to claim ‘skeptic’, fine with me. Just be a nicer one, OK? As I’ve said several times: I don’t really care what people believe, as long as they are polite / nice about it.
-E.M.Smith]
@Chiefio
Okay. But if you have a problem with back radiation, attack the equation itself, and the logic behind it, rather than make snide remarks about its accuracy. Maybe the equation is wrong. Maybe it makes bad predictions. SHOW me how and where! Science ought to be trusted unless one can show it is mistaken. I don’t think you have shown any logical reason why one should not trust the science behind back radiation. That’s my problem with the way you argue. You distrust perfectly good science as a matter of principle, but you won’t put in the effort to tell us what is wrong with the equations, or what the equations should be. Settled science can only be overthown by better science; when it comes to back radiation, I fail to see the better science in anything you have said. I just don’t understand your point of view, your argument. And side arguments about the failure of quantum mechanics to agree with relativity, or with causality, are beside the point: Can you point to a single case where a prediction of QM is wrong? That is the central point: QM has, as far as I or any other quantum mechanic knows, NEVER made a false prediction (as you surely know).
If you have a problem with back radiation, I would appreciate a clear statement of what that problem is, and why you believe conventional theory is wrong. I would then be happy to post a rebuttal.
I hope I will earn my way out of “moderator hell.” Thank you.
[Reply: Eh? Pardon? I had one posting (with an admittedly provoking title – as that is what titled do – that said “Here’s a paper says back radiation is wrong. I can’t see where the paper is wrong.” Hardly saying back radiation is not possible on my part… I do speculate on the only way I could see it being wrong (that Q.M. might have a special case we’ve not seen. Since we just found another one – particles communicating backward in time – that seems reasonably possible.) Then ask for folks to show where the paper is wrong ’cause I’m missing it. Then this posting that says, mostly, “It’s the convection and evaporation / condensation that drives things, back radiation isn’t relevant from CO2.” Again, not saying it isn’t possible, just lost in the micro decimal places. (though I can still see a case for it not being as expected by the proponents.)
So you have issues with me leaving the door open for alternatives. Oh Well. I’ve been around enough I’ve seen a lot of impossible things turn out to be correct, and a lot of absolutely true things shown to be wrong. And I noticed…
Now you want to tell me how I must think. Sorry, that’s a No Go. The equation might well be perfectly good for a lot of things, but have an ‘edge case’ where it fails. Kind of like that whole Newtonian Mechanics, or that GR vs QM ‘issue’, or a dozen others. It could be applied incorrectly due to someone missing an important point. Now I might be missing it too, so if I just blindly do exactly what everyone else does and trust it implicitly I’m going to make the same error and end up in the same mistake. Not my cup of tea…
So what I do is if something is the best we have I use it as long as I can test the results. But I never accept it as absolutely true. (other than a very few math theorems that have been rather well proven and are entirely inside a constructed world anyway…) Please note: I also don’t assert that the theory or tool is never useful and never accurate enough. So I’m happy to use Newtonian mechanics for day to day things. And I’m almost happy with Q.M. for most of what it does. But I’m also willing to accept things like “Maybe LENR can work” on a ‘speculate and test’ basis… Frankly, if you ask me “Do I exist?” (meaning me) I’d likely answer “all evidence seems to indicate so” rather than “yes”. See, “yes” is, um, not proven… “I think, therefor I am.” isn’t quite enough… (It’s a Turing kind of issue… ;-)
Or, in short, there is no such thing as “Settle Science”. There is agreed and useful science, but it’s never “settled” and cast in stone.
Also, please be VERY careful to make a distinction between what I question and what I assert as truth. I do. Now we know that General Relativity and Quantum Mechanics are mutually incompatible. One of them ‘has issues’. But we don’t know which one. You want me to just accept that it can’t be QM. (FWIW, I am more inclined to think GR is wrong). But I just can’t say that I know which one is wrong or incomplete. So no, I can’t just accept either one as absolutely true and complete. I’m happy to use ideas like wave / particle duality and quantum tunneling (we do have devices that we THINK depend on tunneling…). BUT I’m never going to slam shut the door on their maybe having an error or omission. Even if I can’t demonstrate it. Why? The first time something fails will always be in the context of ‘it always worked’..
Even more importantly, I’m not going to accept that people, applying those theories, will never ‘get it wrong’. (That, btw, is also why engineering requires a 50% “safety margin”. Because even in very very well understood systems, sometimes folks ‘get it wrong’. Things as simple as an iron network over water. Now you may think that a ‘bad analogy’ because that is engineering not something as pure as radiation physics. Yet engineering as been called ‘applied physics’. (I actually knew a Ph.D. physics who thought all sciences were just applied physics ;-) So I’m going to be asking questions about “well proven things” forever. I’ll weight them as ever more speculative questions as the body of proof stacks up, but I’ll never drop the ability to ask a question to zero.
Once upon a time, I did. Then way too many ‘absolutely true’ things turned into not so true… I learned.
Now, one minor speculative example. IF a photon can go through two slits at once as a wave, then AFTER doing that, decide to become a particle (because we viewed it) and then reaching back in time tell it’s prior self which slit to pass through as a particle, there isn’t a whole lot to prevent ‘downwelling’ photons from seeing the “upwelling photons” and communicating about what ought to be the net net of their two energies. There is also nothing to prevent those photons from ‘changing their mind’ when we observe them. So the idea that a colder area must radiate energy to a hotter area (despite the 2nd Law of Thermodynamics) because of a “must radiate equally in all directions” argument sure looks to me like something is missing. We have 2 laws in conflict. (And realize that the Tropopause IS the coldest spot, so ‘down welling’ radiation must be going from coldest to hottest…) So which “proven” law do you wish to break? 2nd Law Thermo or a down welling calculation where someone might have missed a trick? Me? I’m just admiring the problem and looking for an approachable and understandable proof one way, or the other, or that it’s an insoluble. (Like that time traveling particle 2 slit problem…)
And it isn’t enough to just say ‘Trust the QM, Luke’. Because I also must “Trust the 2nd Law”…
I’m most inclined to think that we’ve got folks doing radiative physics in a non-radiative context; that the air is doing mass flow and enthalpy enough to overmatch the radiative; I’m secondarily inclined to think that we’ve got ‘downwelling’ from beyond the tropopause and out of the CO2 band, but nobody ever seems to look at that. Get to the top of the Stratosphere approaching the Thermosphere, hey, I’m happy with ‘down welling’ from hotter to colder…. But just say “it’s radiation, trust it” is not enough.
Final point: Look at the weather reports. Snow all over the N. H. and more on the way. It’s cold, and getting colder. There’s clearly something broken in the AGW physics and math. If folks are forbidden to ask ‘might it be here’ about ANY areas, then there is a high risk of not finding out what it is. An “exhaustive search” by definition involves asking “Could this absolutely impossible place be where it is?”. I’ve found a lot of computer bugs in “places they just can’t be” and I’ve seen a lot of highly educated folks think they could not possibly have made the error that they made. If you have eliminated all the possible explanations, then it must be one of the impossible ones. A rough paraphrase of Holmes, IIRC.
At any rate, it’s late, I’m sleepy and starting to ramble. Time to go. -E.M.Smith]
Thanks and all I can say is you have don it again.
I was already wandering down this road of the wobbly tropo and stato but you have clarified beyond my best efforts.
IMO CO2 is the minor player in atmospheric movements, as you aptly point out, water is the king pin here. And it is the bulk movement of air masses that give us our variable weather. The big problem with the “CO2 rules the climate” (IMO) is that measurements do not match the theory.
As I read this post, I started thinking about how it seems warmists follow the KISS principle (Keep It Simple Stupid), and that your explanation was really trying to see the atmosphere, and heat transfer, as complex, which is how I see it. This saying is attributed to Einstein, but I’ve since read that it seems to have come from a poet who was summarizing his comments. This is my own paraphrasing: “Keep it simple, but no simpler than necessary to describe the phenomenon.” In other words, don’t simplify just because it’s convenient, or makes the problem seemingly easier to deal with.
Looking at the argument between E.M. and Peter, I got the impression that it’s an argument between a scientist and an applied mathematician. I very much agree with E.M.’s comments re. how in science nothing is ever definitive. There are boundary conditions to all scientific models. The common conception of science is that it discovers truth. From my standpoint it does not. It finds approximations of truth, many of them extremely good, but within some bounds.
The unfortunate thing about the use of math in science is it’s tempting for people in science to say, “Because we have this math, and it’s widely accepted by colleagues, it is law,” which maps well into the concept, “Because it is written, and socially accepted, it is law.” Never mind if the “law” is compatible with reality. “Because it is written” has no bearing on what’s going on in reality. Reality is the ultimate critic of “what is written.”
I get the impression that this happens because mathematics conveys this sense that you can find truth in it, because it’s rational and logical. Yes, you can find truth within the abstraction in its own right, as long as you are clear you are *only* working within the realm of the abstraction, not reality. People forget that the purpose of the mathematical expression of a model is to succinctly convey the model, not reality. The tricky thing in science is to find where the model maps well to reality, and where it doesn’t. The model is just a model. It is there to be helpful in dealing with reality. It is not in itself reality, or a reading of reality. It is science’s best guess as to what reality is *like*. There’s no reason these models shouldn’t be taught, and there’s no reason they shouldn’t be used, but it should be made clear what they are, and what they are not. If reality does not comport with the model, then we have just found a boundary for the model, if not completely shown that it is wrong. Then it’s back to the drawing board to explain what was just observed, or in this case, interpreted.
This brings me to a point about E.M.’s post. Nowhere did I see, “Using this instrumentation, X methodology, under Y-set of conditions, I have observed A, B, and C.” It’s an interpretation of data gathered elsewhere. This leaves others free to interpret it differently, and one question that arises is, “What do we know about the data gathered?” Does it have a low error rating in all its aspects? Is there another data set that’s more accurate? How much variability is there in the data set? In other words, did this instance E.M. showed just happen to fit his theory well, and others would contradict it? Does his theory fit the overall data set better than others? Assuming that’s all fine and good, then the next step would be to try to formulate some models for prediction, so that scientists can look at the issue of, “Okay. So far so good. Now let’s step into the unknown. Lay down something that can be compared against in the future, with data that hasn’t been collected yet.”
Ignoring all this for the moment, if your theory, E.M., could be validated in a fashion something like this, then I think you’ve killed two birds with one stone nicely. On the one hand, you may have explained why some warmists have complained for years about stratospheric cooling, and at the same time you may have added to a piece of the puzzle, which was contributed to a few years ago by Dr. Richard Lindzen. He talked about a 15-year study he supervised from 1985-1999 inclusive (he says “16-year,” but either his time range is off, or he’s got the years wrong), using a couple satellites to measure radiation escaping to space over the tropics, which showed that as our warming period occurred, and the surface temperature increased, the radiation to space increased as well, contradicting the IPCC’s prediction that the result would be the exact opposite; that as the surface warmed, a positive feedback loop process would kick in, resulting in greater and greater warming of the surface, and less radiation escaping.
You can see him talk about it here:
http://www.viddler.com/v/79d667f3
In most of it he’s talking about the illogic and politics of climate science. He gets to the observed data 39 minutes into the talk.
For the math to work, you must already understand the science. You can not create a valid mathematical model from poor understanding. The computer models that were developed by climate scientists were created in the hopes that supercomputers could create answers for the budding new “science”. GI=GO was the result, but it provided a base that AGW could be constructed upon. The politics of climate science is completely logical, just not scientifically valid. Politics and religion has its’ own logic. The logic of control of others, for their own good of course! pg
@p.g.sharrow:
I don’t know if you were addressing this point. What I was saying was there’s a difference between dealing purely with a mathematical model in its own right and actually doing the science on the actual subject at hand. It seems like there are a lot of people who confuse the two. Like you were saying, you can’t just put a lot of mathematics together, even if it’s scientifically derived, in a computer model and assume you’ve created an environment that can produce “evidence.” That’s pseudoscience, just taking mathematics and calling it “science.”
Peter asked about the Swarzchild Equation, “What part of it do you have a problem with?” I don’t mean to put words in his mouth, but it seems to me what E.M. was saying is, “That’s not the point. I don’t have a problem with the equation. The question is its significance, and to some extent its applicability, to the issue at hand.”
I got a sense that they’re talking about two different ideas about radiative transfer of energy. They disagree about the process. Peter talks about the transference of heat from one molecule to the next, and says that’s the end of it. I get the image of a Pachinko or pinball machine metaphor, where the “heat” is the ball, and the molecules are the fixed “bumpers” that bounce it around. E.M. says, “Yes, that happens, but the ‘bumpers’ are not fixed. There is also movement of mass (convection), changes in ambient temperature with altitude, mixing of gases, which is much more significant.” My impression of E.M.’s argument is that mass is transported with the energy. Like E.M. was saying, a static vs. dynamic model argument.
One thing the warmists should keep in mind is that it’s fairly common knowledge in atmospheric science that air can be modeled perfectly well as a fluid. If people question E.M.’s theory, just put a beaker of water on a burner. Once it heats up, put a little food coloring in it, and watch it go. Contemplate the steam that comes out the top… It’s not an exact analog to what’s going on, but it gets the idea about convective cooling across.
Reblogged this on Standard Climate.
About your Modtran “Why This Chart Doesn’t Matter”.
Well Modtran is right there, that is it just show what a real spectrometer will see if placed at that altitude. The problem is that in no ways that’s the outgoing radiation, and in no ways that pit represents the CO2 absorption.
This is a 2006 research made by Franch/Italian scientist:
Click to access acp-6-5025-2006.pdf
Look at fig.1 and note the mirror at the spectrometer input slit. That mirror allowed the spectrometer to move its field of view from nadir to the so called “limb” view.
I expected to see exactly what fig.3 shows. That is, there is an outgoing peak exactly where at the nadir the spectrometer sees the CO2 pit (yes, it is because that radiation is tangent to the atmosphere, which being almost spherical make that radiation .outgoing).
When CO2 concentration increases, as the nadir pit became deeper that peak of non-nadir outgoing scattered radiation became higher.
To compute the right (if any exists) real energy back radiation, one should integrate the whole half spherical view of the input slit of the spectrometer for each TOA point; and if exist it must be many times lesser than those hypothesized by the climatologists.
Any spectrometer is absolutely blind versus the scattered radiation which enters it’s slit with an angle greater of its own field of view.